The E. coli SufS-SufE sulfur transfer system is more resistant to oxidative stress than IscS-IscU
- PMID: 23068614
- PMCID: PMC3511050
- DOI: 10.1016/j.febslet.2012.10.001
The E. coli SufS-SufE sulfur transfer system is more resistant to oxidative stress than IscS-IscU
Abstract
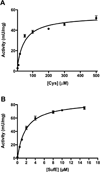
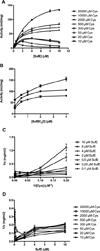
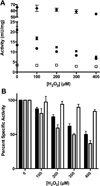
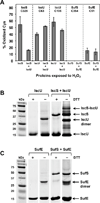
During oxidative stress in Escherichiacoli, the SufABCDSE stress response pathway mediates iron-sulfur (Fe-S) cluster biogenesis rather than the Isc pathway. To determine why the Suf pathway is favored under stress conditions, the stress response SufS-SufE sulfur transfer pathway and the basal housekeeping IscS-IscU pathway were directly compared. We found that SufS-SufE cysteine desulfurase activity is significantly higher than IscS-IscU at physiological cysteine concentrations and after exposure to H(2)O(2). Mass spectrometry analysis demonstrated that IscS-IscU is more susceptible than SufS-SufE to oxidative modification by H(2)O(2). These important results provide biochemical insight into the stress resistance of the Suf pathway.
Copyright © 2012 Federation of European Biochemical Societies. Published by Elsevier B.V. All rights reserved.
Figures


Similar articles
-
The SufE sulfur-acceptor protein contains a conserved core structure that mediates interdomain interactions in a variety of redox protein complexes.J Mol Biol. 2004 Nov 19;344(2):549-65. doi: 10.1016/j.jmb.2004.08.074. J Mol Biol. 2004. PMID: 15522304
-
The β-latch structural element of the SufS cysteine desulfurase mediates active site accessibility and SufE transpersulfurase positioning.J Biol Chem. 2023 Mar;299(3):102966. doi: 10.1016/j.jbc.2023.102966. Epub 2023 Feb 1. J Biol Chem. 2023. PMID: 36736428 Free PMC article.
-
The SufE protein and the SufBCD complex enhance SufS cysteine desulfurase activity as part of a sulfur transfer pathway for Fe-S cluster assembly in Escherichia coli.J Biol Chem. 2003 Nov 14;278(46):45713-9. doi: 10.1074/jbc.M308004200. Epub 2003 Aug 26. J Biol Chem. 2003. PMID: 12941942
-
Fe-S cluster biogenesis by the bacterial Suf pathway.Biochim Biophys Acta Mol Cell Res. 2020 Nov;1867(11):118829. doi: 10.1016/j.bbamcr.2020.118829. Epub 2020 Aug 18. Biochim Biophys Acta Mol Cell Res. 2020. PMID: 32822728 Free PMC article. Review.
-
Interplay between oxygen and Fe-S cluster biogenesis: insights from the Suf pathway.Biochemistry. 2014 Sep 23;53(37):5834-47. doi: 10.1021/bi500488r. Epub 2014 Sep 11. Biochemistry. 2014. PMID: 25153801 Free PMC article. Review.
Cited by
-
Two conserved arginine residues facilitate C-S bond cleavage and persulfide transfer in Suf family cysteine desulfurases.bioRxiv [Preprint]. 2024 Oct 17:2024.10.17.618868. doi: 10.1101/2024.10.17.618868. bioRxiv. 2024. PMID: 39464115 Free PMC article. Preprint.
-
Optimized methyl donor and reduced precursor degradation pathway for seleno-methylselenocysteine production in Bacillus subtilis.Microb Cell Fact. 2023 Oct 19;22(1):215. doi: 10.1186/s12934-023-02203-1. Microb Cell Fact. 2023. PMID: 37853389 Free PMC article.
-
Increased Synthesis of a Magnesium Transporter MgtA During Recombinant Autotransporter Expression in Escherichia coli.Appl Biochem Biotechnol. 2021 Nov;193(11):3672-3703. doi: 10.1007/s12010-021-03634-5. Epub 2021 Aug 5. Appl Biochem Biotechnol. 2021. PMID: 34351586
-
The sulfur formation system mediating extracellular cysteine-cystine recycling in Fervidobacterium islandicum AW-1 is associated with keratin degradation.Microb Biotechnol. 2021 May;14(3):938-952. doi: 10.1111/1751-7915.13717. Epub 2020 Dec 15. Microb Biotechnol. 2021. PMID: 33320434 Free PMC article.
-
Regulation of Iron Storage by CsrA Supports Exponential Growth of Escherichia coli.mBio. 2019 Aug 6;10(4):e01034-19. doi: 10.1128/mBio.01034-19. mBio. 2019. PMID: 31387901 Free PMC article.
References
-
- Meyer J. Iron-sulfur protein folds, iron-sulfur chemistry, and evolution. J Biol Inorg Chem. 2008;13:157–170. - PubMed
-
- Sheftel A, Stehling O, Lill R. Iron-sulfur proteins in health and disease. Trends Endocrinol Metab. 2010;21:302–314. - PubMed
-
- Shepard EM, Boyd ES, Broderick JB, Peters JW. Biosynthesis of complex iron-sulfur enzymes. Curr Opin Chem Biol. 2011;15:319–327. - PubMed
-
- Xu XM, Moller SG. Iron-sulfur clusters: biogenesis, molecular mechanisms, and their functional significance. Antioxid Redox Signal. 2011;15:271–307. - PubMed
Publication types
MeSH terms
Substances
Grants and funding
LinkOut - more resources
Full Text Sources
Molecular Biology Databases
Miscellaneous

