

Mood is a key determinant of cognitive performance in community-dwelling older adults: a cross-sectional analysis
- PMID: 23054829
- PMCID: PMC3776101
- DOI: 10.1007/s11357-012-9482-y
Mood is a key determinant of cognitive performance in community-dwelling older adults: a cross-sectional analysis
Abstract
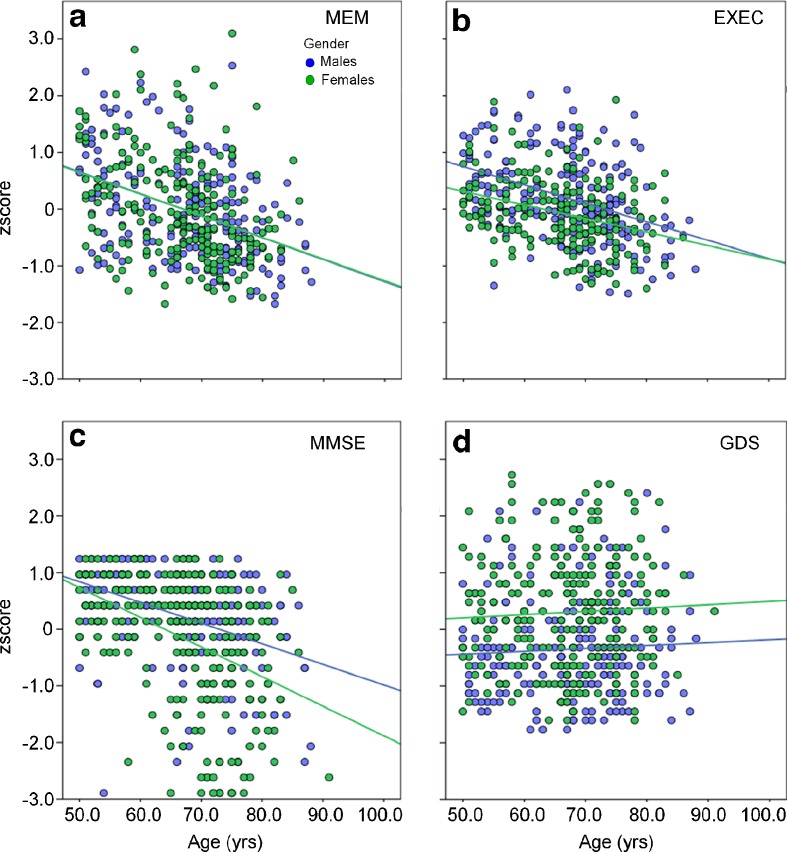
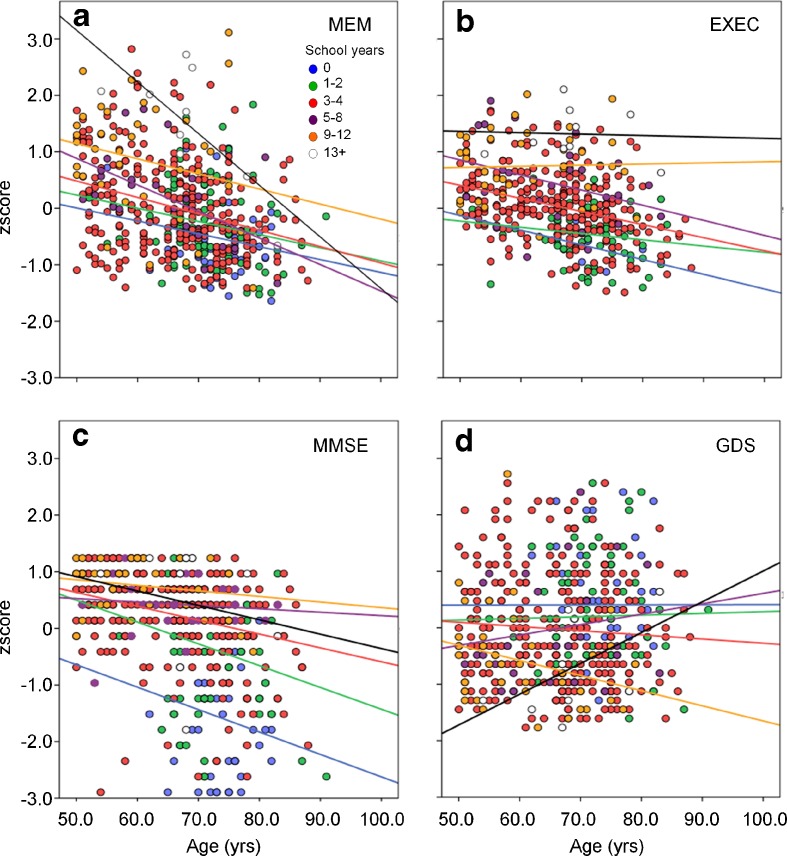
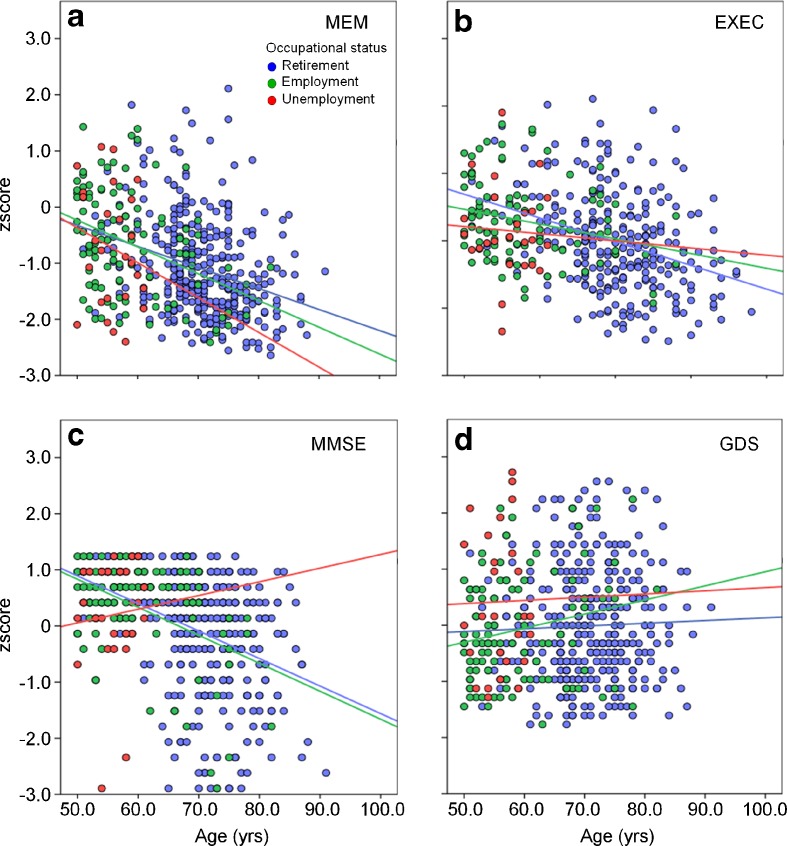
Identification of predictors of cognitive trajectories through the establishment of composite or single-parameter dimensional categories of cognition and mood may facilitate development of strategies to improve quality of life in the elderly. Participants (n = 487, aged 50+ years) were representative of the Portuguese population in terms of age, gender, and educational status. Cognitive and mood profiles were established using a battery of neurocognitive and psychological tests. Data were subjected to principal component analysis to identify core dimensions of cognition and mood, encompassing multiple test variables. Dimensions were correlated with age and with respect to gender, education, and occupational status. Cluster analysis was applied to isolate distinct patterns of cognitive performance and binary logistic regression models to explore interrelationships between aging, cognition, mood, and socio-demographic characteristics. Four main dimensions were identified: memory, executive function, global cognitive status, and mood. Based on these, strong and weak cognitive performers were distinguishable. Cluster analysis revealed further distinction within these two main categories into very good, good, poor, and very poor performers. Mood was the principal factor contributing to the separation between very good and good, as well as poor and very poor, performers. Clustering was also influenced by gender and education, albeit to a lesser extent; notably, however, female gender × lower educational background predicted significantly poorer cognitive performance with increasing age. Mood has a significant impact on the rate of cognitive decline in the elderly. Gender and educational level are early determinants of cognitive performance in later life.
Figures


Similar articles
-
Discriminant power of socio-demographic characteristics and mood in distinguishing cognitive performance clusters in older individuals: a cross-sectional analysis.Aging Ment Health. 2017 May;21(5):537-542. doi: 10.1080/13607863.2015.1128879. Epub 2016 Jan 12. Aging Ment Health. 2017. PMID: 26756965
-
Demographic, neuropsychological, and functional predictors of rate of longitudinal cognitive decline in Hispanic older adults.Am J Geriatr Psychiatry. 2011 May;19(5):440-50. doi: 10.1097/JGP.0b013e3181e9b9a5. Am J Geriatr Psychiatry. 2011. PMID: 20808135 Free PMC article.
-
Age-related cognitive decline in patients with mood disorders.Prog Neuropsychopharmacol Biol Psychiatry. 2008 May 15;32(4):962-7. doi: 10.1016/j.pnpbp.2007.12.030. Epub 2008 Jan 11. Prog Neuropsychopharmacol Biol Psychiatry. 2008. PMID: 18243461
-
Cognitive deficits in bipolar disorders: Implications for emotion.Clin Psychol Rev. 2018 Feb;59:126-136. doi: 10.1016/j.cpr.2017.11.006. Epub 2017 Nov 21. Clin Psychol Rev. 2018. PMID: 29195773 Free PMC article. Review.
-
Dehydration influences mood and cognition: a plausible hypothesis?Nutrients. 2011 May;3(5):555-73. doi: 10.3390/nu3050555. Epub 2011 May 10. Nutrients. 2011. PMID: 22254111 Free PMC article. Review.
Cited by
-
The Bounds Of Education In The Human Brain Connectome.Sci Rep. 2015 Aug 6;5:12812. doi: 10.1038/srep12812. Sci Rep. 2015. PMID: 26245669 Free PMC article. Clinical Trial.
-
Structural and molecular correlates of cognitive aging in the rat.Sci Rep. 2019 Feb 14;9(1):2005. doi: 10.1038/s41598-019-39645-w. Sci Rep. 2019. PMID: 30765864 Free PMC article.
-
The use of bayesian latent class cluster models to classify patterns of cognitive performance in healthy ageing.PLoS One. 2013 Aug 20;8(8):e71940. doi: 10.1371/journal.pone.0071940. eCollection 2013. PLoS One. 2013. PMID: 23977183 Free PMC article.
-
The Association of Metabolic Dysfunction and Mood Across Lifespan Interacts With the Default Mode Network Functional Connectivity.Front Aging Neurosci. 2021 Aug 2;13:618623. doi: 10.3389/fnagi.2021.618623. eCollection 2021. Front Aging Neurosci. 2021. PMID: 34408637 Free PMC article.
-
Antidepressant responsiveness in adulthood is permanently impaired after neonatal destruction of the neurogenic pool.Transl Psychiatry. 2017 Jan 3;7(1):e990. doi: 10.1038/tp.2016.255. Transl Psychiatry. 2017. PMID: 28045461 Free PMC article.
References
-
- Ardila A, Ostrosky-Solis F, Rosselli M, Gómez C. Age-related cognitive decline during normal aging: the complex effect of education. Arch Clin Neuropsychol. 2000;15:495–513. - PubMed
Publication types
MeSH terms
LinkOut - more resources
Full Text Sources
Medical