Molecular analysis of HER2 signaling in human breast cancer by functional protein pathway activation mapping
- PMID: 23045247
- PMCID: PMC5581198
- DOI: 10.1158/1078-0432.CCR-12-0452
Molecular analysis of HER2 signaling in human breast cancer by functional protein pathway activation mapping
Abstract
Purpose: Targeting of the HER2 protein in human breast cancer represents a major advance in oncology but relies on measurements of total HER2 protein and not HER2 signaling network activation. We used reverse-phase protein microarrays (RPMA) to measure total and phosphorylated HER2 in the context of HER family signaling to understand correlations between phosphorylated and total levels of HER2 and downstream signaling activity.
Experimental design: Three independent study sets, comprising a total of 415 individual patient samples from flash-frozen core biopsy samples and formalin-fixed and paraffin-embedded (FFPE) surgical and core samples, were analyzed via RPMA. The phosphorylation and total levels of the HER receptor family proteins and downstream signaling molecules were measured in laser capture microdissected (LCM) enriched tumor epithelium from 127 frozen pretreatment core biopsy samples and whole-tissue lysates from 288 FFPE samples and these results were compared with FISH and immunohistochemistry (IHC).
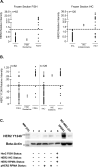
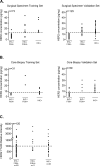
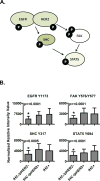
Results: RPMA measurements of total HER2 were highly concordant (>90% all sets) with FISH and/or IHC data, as was phosphorylation of HER2 in the FISH/IHC(+) population. Phosphorylation analysis of HER family signaling identified HER2 activation in some FISH/IHC(-) tumors and, identical to that seen with FISH/IHC(+) tumors, the HER2 activation was concordant with EGF receptor (EGFR) and HER3 phosphorylation and downstream signaling endpoint activation.
Conclusions: Molecular profiling of HER2 signaling of a large cohort of human breast cancer specimens using a quantitative and sensitive functional pathway activation mapping technique reveals IHC(-)/FISH(-)/pHER2(+) tumors with HER2 pathway activation independent of total HER2 levels and functional signaling through HER3 and EGFR.
©2012 AACR.
Conflict of interest statement
Stock ownership in Theranostics Health, LLC: (JDW, VE, MP,LAL, EFP);
Uncompensated consultancy Theranostics Health, LLC: (JDW, VE, LAL, EFP);
Advisory role in Theranostics Health, LLC: (LAL, EFP)
Figures


Comment in
-
Reverse-phase protein microarray highlights HER2 signaling activation in immunohistochemistry/FISH/HER2-negative breast cancers.Expert Rev Proteomics. 2013 Jun;10(3):223-6. doi: 10.1586/epr.13.18. Expert Rev Proteomics. 2013. PMID: 23777213
Similar articles
-
Reverse-phase protein microarray highlights HER2 signaling activation in immunohistochemistry/FISH/HER2-negative breast cancers.Expert Rev Proteomics. 2013 Jun;10(3):223-6. doi: 10.1586/epr.13.18. Expert Rev Proteomics. 2013. PMID: 23777213
-
Droplet digital polymerase chain reaction detection of HER2 amplification in formalin fixed paraffin embedded breast and gastric carcinoma samples.Exp Mol Pathol. 2016 Apr;100(2):287-93. doi: 10.1016/j.yexmp.2015.11.027. Epub 2015 Nov 25. Exp Mol Pathol. 2016. PMID: 26626802
-
Human epidermal growth factor receptor 2 testing in gastroesophageal cancer: correlation between immunohistochemistry and fluorescence in situ hybridization.Arch Pathol Lab Med. 2011 Nov;135(11):1460-5. doi: 10.5858/arpa.2010-0541-OA. Arch Pathol Lab Med. 2011. PMID: 22032573
-
Profiling signalling pathways in formalin-fixed and paraffin-embedded breast cancer tissues reveals cross-talk between EGFR, HER2, HER3 and uPAR.J Cell Physiol. 2012 Jan;227(1):204-12. doi: 10.1002/jcp.22718. J Cell Physiol. 2012. PMID: 21391216
-
Quantification of HER family receptors in breast cancer.Breast Cancer Res. 2015 Apr 9;17:53. doi: 10.1186/s13058-015-0561-8. Breast Cancer Res. 2015. PMID: 25887735 Free PMC article. Review.
Cited by
-
Cofilin hyperactivation in HIV infection and targeting the cofilin pathway using an anti-α4β7 integrin antibody.Sci Adv. 2019 Jan 9;5(1):eaat7911. doi: 10.1126/sciadv.aat7911. eCollection 2019 Jan. Sci Adv. 2019. PMID: 30662943 Free PMC article. Clinical Trial.
-
Impact of upfront cellular enrichment by laser capture microdissection on protein and phosphoprotein drug target signaling activation measurements in human lung cancer: Implications for personalized medicine.Proteomics Clin Appl. 2015 Oct;9(9-10):928-37. doi: 10.1002/prca.201400056. Epub 2015 Mar 24. Proteomics Clin Appl. 2015. PMID: 25676683 Free PMC article.
-
Implications of functional proteomics in breast cancer.Oncologist. 2014 Apr;19(4):328-35. doi: 10.1634/theoncologist.2013-0437. Epub 2014 Mar 24. Oncologist. 2014. PMID: 24664486 Free PMC article. Review.
-
Evaluation of the HER/PI3K/AKT Family Signaling Network as a Predictive Biomarker of Pathologic Complete Response for Patients With Breast Cancer Treated With Neratinib in the I-SPY 2 TRIAL.JCO Precis Oncol. 2018 Aug 16;2:PO.18.00024. doi: 10.1200/PO.18.00024. eCollection 2018. JCO Precis Oncol. 2018. PMID: 32914002 Free PMC article.
-
Proteomic Analysis of Cardioembolic and Large Artery Atherosclerotic Clots Using Reverse Phase Protein Array Technology Reveals Key Cellular Interactions Within Clot Microenvironments.Cureus. 2021 Feb 22;13(2):e13499. doi: 10.7759/cureus.13499. Cureus. 2021. PMID: 33777584 Free PMC article.
References
-
- Hynes NE, Lane HA. ERBB receptors and cancer: the complexity of targeted inhibitors. Nat Rev Cancer. 2005;5:341–354. - PubMed
-
- Schlessinger J. Cell signaling by receptor tyrosine kinases. Cell. 2000;103:211–225. - PubMed
-
- Yarden Y, Sliwkowski MX. Untangling the ErbB signalling network. Nat Rev Mol Cell Biol. 2001;2:127–137. - PubMed
-
- Piccart-Gebhart MJ, Procter M, Leyland-Jones B, Goldhirsch A, Untch M, Smith I, et al. Trastuzumab after adjuvant chemotherapy in HER2-positive breast cancer. N Engl J Med. 2005;353:1659–1672. - PubMed
-
- Romond EH, Perez EA, Bryant J, Geyer CE, Jr, Davidson NE, et al. Trastuzumab plus adjuvant chemotherapy for operable HER2-positive breast cancer. N Engl J Med. 2005;353:1673–1684. - PubMed
Publication types
MeSH terms
Substances
Grants and funding
LinkOut - more resources
Full Text Sources
Other Literature Sources
Medical
Research Materials
Miscellaneous

