Insights into the role of heme in the mechanism of action of antimalarials
- PMID: 23043646
- PMCID: PMC3548943
- DOI: 10.1021/cb300454t
Insights into the role of heme in the mechanism of action of antimalarials
Abstract
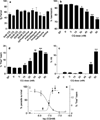
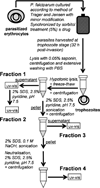
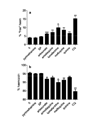
By using cell fractionation and measurement of Fe(III)heme-pyridine, the antimalarial chloroquine (CQ) has been shown to cause a dose-dependent decrease in hemozoin and concomitant increase in toxic free heme in cultured Plasmodium falciparum that is directly correlated with parasite survival. Transmission electron microscopy techniques have further shown that heme is redistributed from the parasite digestive vacuole to the cytoplasm and that CQ disrupts hemozoin crystal growth, resulting in mosaic boundaries in the crystals formed in the parasite. Extension of the cell fractionation study to other drugs has shown that artesunate, amodiaquine, lumefantrine, mefloquine, and quinine, all clinically important antimalarials, also inhibit hemozoin formation in the parasite cell, while the antifolate pyrimethamine and its combination with sulfadoxine do not. This study finally provides direct evidence in support of the hemozoin inhibition hypothesis for the mechanism of action of CQ and shows that other quinoline and related antimalarials inhibit cellular hemozoin formation.
Figures


Similar articles
-
Optimization of a multi-well colorimetric assay to determine haem species in Plasmodium falciparum in the presence of anti-malarials.Malar J. 2015 Jun 24;14:253. doi: 10.1186/s12936-015-0729-9. Malar J. 2015. PMID: 26099266 Free PMC article.
-
Inhibition of glutathione-dependent degradation of heme by chloroquine and amodiaquine as a possible basis for their antimalarial mode of action.Biochem Pharmacol. 1998 Nov 15;56(10):1305-13. doi: 10.1016/s0006-2952(98)00184-1. Biochem Pharmacol. 1998. PMID: 9825729
-
Heme Detoxification in the Malaria Parasite: A Target for Antimalarial Drug Development.Acc Chem Res. 2021 Jun 1;54(11):2649-2659. doi: 10.1021/acs.accounts.1c00154. Epub 2021 May 13. Acc Chem Res. 2021. PMID: 33982570 Free PMC article. Review.
-
Considerations on the mechanism of action of artemisinin antimalarials: part 1--the 'carbon radical' and 'heme' hypotheses.Infect Disord Drug Targets. 2013 Aug;13(4):217-77. doi: 10.2174/1871526513666131129155708. Infect Disord Drug Targets. 2013. PMID: 24304352 Review.
-
A Variant PfCRT Isoform Can Contribute to Plasmodium falciparum Resistance to the First-Line Partner Drug Piperaquine.mBio. 2017 May 9;8(3):e00303-17. doi: 10.1128/mBio.00303-17. mBio. 2017. PMID: 28487425 Free PMC article.
Cited by
-
Molecular Mechanisms of Drug Resistance in Plasmodium falciparum Malaria.Annu Rev Microbiol. 2020 Sep 8;74:431-454. doi: 10.1146/annurev-micro-020518-115546. Annu Rev Microbiol. 2020. PMID: 32905757 Free PMC article. Review.
-
Physicochemical Profiling and Comparison of Research Antiplasmodials and Advanced Stage Antimalarials with Oral Drugs.ACS Omega. 2021 Feb 25;6(9):6424-6437. doi: 10.1021/acsomega.1c00104. eCollection 2021 Mar 9. ACS Omega. 2021. PMID: 33718733 Free PMC article.
-
2,8-Disubstituted-1,5-naphthyridines as Dual Inhibitors of Plasmodium falciparum Phosphatidylinositol-4-kinase and Hemozoin Formation with In Vivo Efficacy.J Med Chem. 2024 Jul 11;67(13):11401-11420. doi: 10.1021/acs.jmedchem.4c01154. Epub 2024 Jun 25. J Med Chem. 2024. PMID: 38918002 Free PMC article.
-
Heme crystallization in a Chagas disease vector acts as a redox-protective mechanism to allow insect reproduction and parasite infection.PLoS Negl Trop Dis. 2018 Jul 23;12(7):e0006661. doi: 10.1371/journal.pntd.0006661. eCollection 2018 Jul. PLoS Negl Trop Dis. 2018. PMID: 30036366 Free PMC article.
-
The Role of the Iron Protoporphyrins Heme and Hematin in the Antimalarial Activity of Endoperoxide Drugs.Pharmaceuticals (Basel). 2022 Jan 4;15(1):60. doi: 10.3390/ph15010060. Pharmaceuticals (Basel). 2022. PMID: 35056117 Free PMC article. Review.
References
-
- Tilley L, Dixon MWA, Kirk K. The Plasmodium falciparum-infected red blood cell. Int. J. Biochem. Cell Biol. 2011;43:839–842. - PubMed
-
- Chou AC, Chevli R, Fitch CD. Ferriprotoporphyrin IX fulfills the criteria for identification as the chloroquine receptor of malaria parasites. Biochemistry. 1980;19:1543–1549. - PubMed
-
- Slater AFG, Cerami A. Inhibition by chloroquine of a novel haem polymerase enzyme activity in malaria trophozoites. Nature. 1992;355:167–169. - PubMed
-
- Egan TJ, Ross DC, Adams PA. Quinoline anti-malarial drugs inhibit spontaneous formation of b-haematin (malaria pigment) FEBS Lett. 1994;352:54–57. - PubMed
Publication types
MeSH terms
Substances
Grants and funding
LinkOut - more resources
Full Text Sources
Other Literature Sources

