

Skin- and gut-homing molecules on human circulating γδ T cells and their dysregulation in inflammatory bowel disease
- PMID: 23039882
- PMCID: PMC3482358
- DOI: 10.1111/j.1365-2249.2012.04649.x
Skin- and gut-homing molecules on human circulating γδ T cells and their dysregulation in inflammatory bowel disease
Abstract
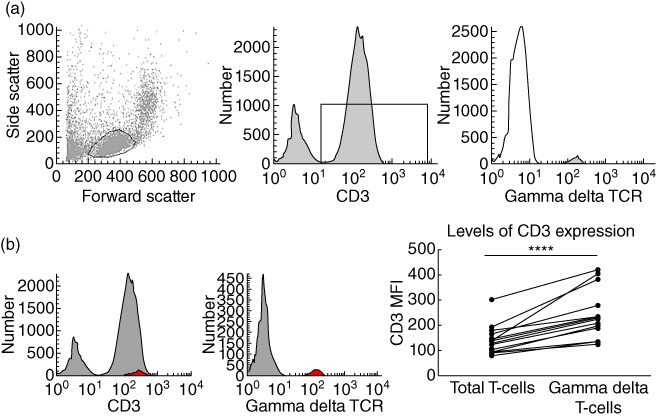
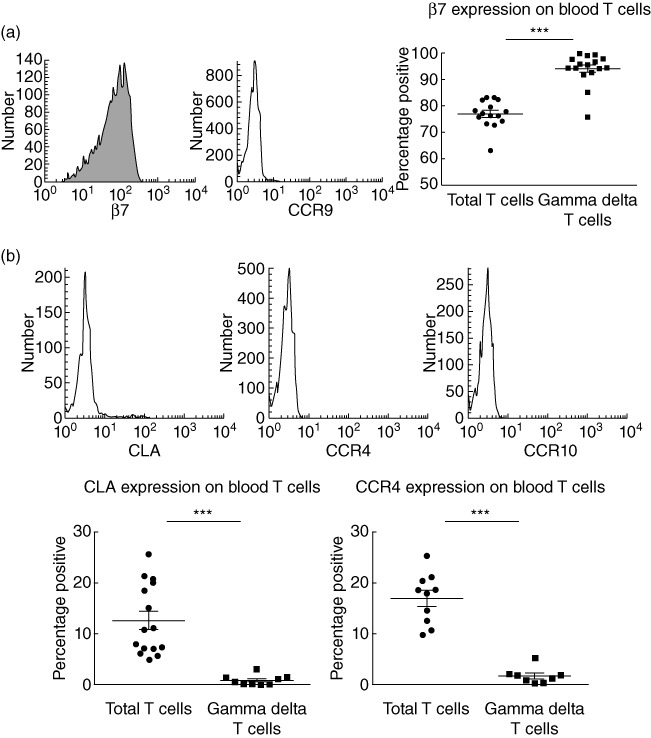
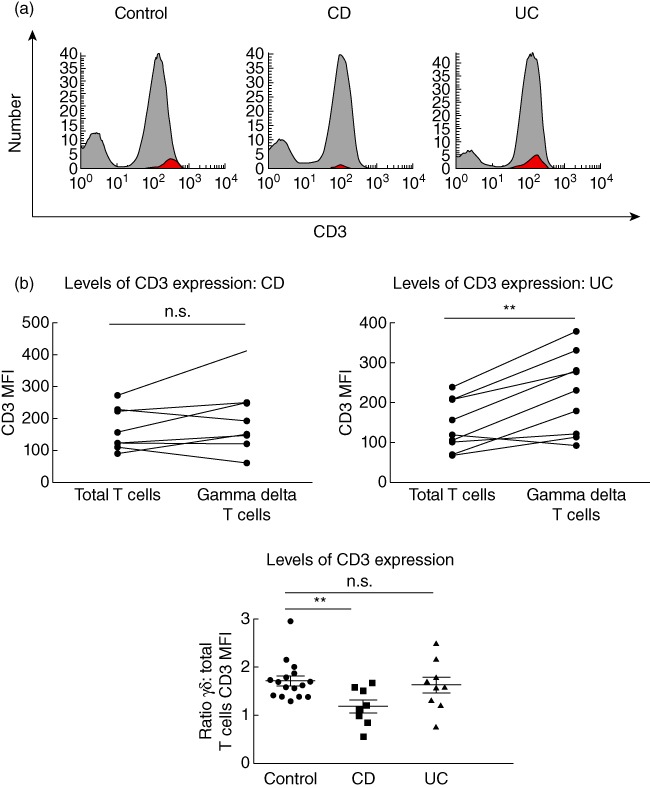
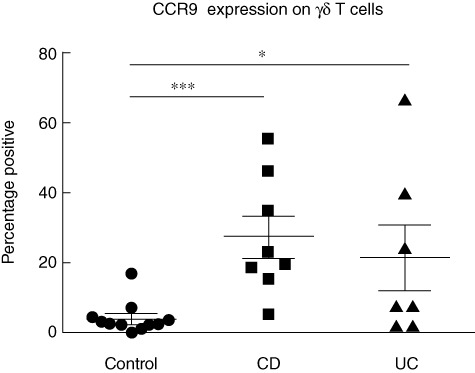
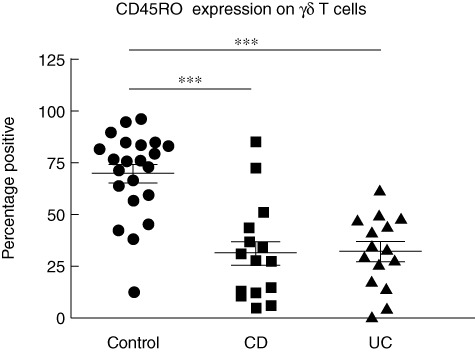
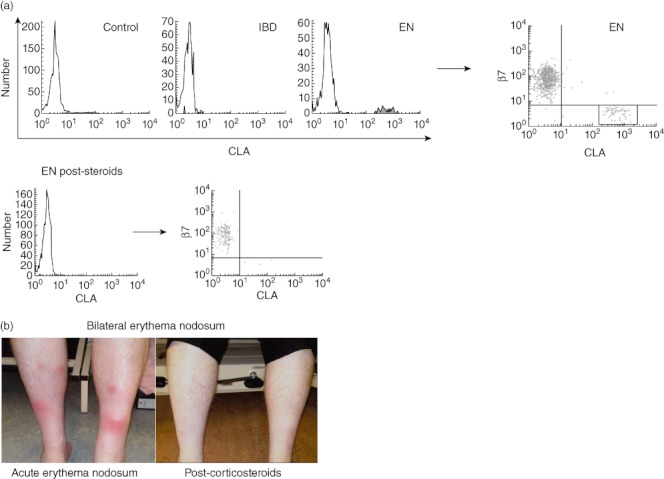
Changes in phenotype and function of γδ T cells have been reported in inflammatory bowel disease (IBD), including Crohn's disease (CD) and ulcerative colitis (UC). Dysregulation of lymphocyte migration plays a key role in IBD pathogenesis; however, data on migratory properties of γδ T cells are scarce. Human circulating γδ T cells from healthy controls (n = 27), patients with active CD (n = 15), active UC (n = 14) or cutaneous manifestations of IBD (n = 2) were characterized by flow cytometry. Circulating γδ T cells in healthy controls were CD3(hi) and expressed CD45RO. They expressed gut-homing molecule β7 but not gut-homing molecule corresponding chemokine receptors (CCR)9, or skin-homing molecules cutaneous lymphocyte-associated antigen (CLA) and CCR4, despite conventional T cells containing populations expressing these molecules. CCR9 expression was increased on γδ T cells in CD and UC, while skin-homing CLA was expressed aberrantly on γδ T cells in patients with cutaneous manifestations of IBD. Lower levels of CD3 expression were found on γδ T cells in CD but not in UC, and a lower proportion of γδ T cells expressed CD45RO in CD and UC. Enhanced expression of gut-homing molecules on circulating γδ T cells in IBD and skin-homing molecules in cutaneous manifestations of IBD may be of clinical relevance.
© 2012 The Authors. Clinical and Experimental Immunology © 2012 British Society for Immunology.
Figures
Similar articles
-
Altered expression of alpha 4 beta 7, a gut homing integrin, by circulating and mucosal T cells in colonic mucosal inflammation.Gut. 1997 Feb;40(2):241-6. doi: 10.1136/gut.40.2.241. Gut. 1997. PMID: 9071939 Free PMC article.
-
Human cerebrospinal fluid contains CD4+ memory T cells expressing gut- or skin-specific trafficking determinants: relevance for immunotherapy.BMC Immunol. 2006 Jul 7;7:14. doi: 10.1186/1471-2172-7-14. BMC Immunol. 2006. PMID: 16824229 Free PMC article.
-
Expression of lymphocyte-endothelial receptor-ligand pairs, alpha4beta7/MAdCAM-1 and OX40/OX40 ligand in the colon and jejunum of patients with inflammatory bowel disease.Gut. 1999 Dec;45(6):856-63. doi: 10.1136/gut.45.6.856. Gut. 1999. PMID: 10562584 Free PMC article.
-
Skin-homing T cells in human cutaneous allergic inflammation.Immunol Res. 1995;14(4):317-24. doi: 10.1007/BF02935627. Immunol Res. 1995. PMID: 8722046 Review.
-
Circulating CLA+ T cells in atopic dermatitis and their possible role as peripheral biomarkers.Allergy. 2017 Mar;72(3):366-372. doi: 10.1111/all.13080. Epub 2016 Dec 15. Allergy. 2017. PMID: 27861978 Review.
Cited by
-
Human γδ T-Cell Control of Mucosal Immunity and Inflammation.Front Immunol. 2018 May 7;9:985. doi: 10.3389/fimmu.2018.00985. eCollection 2018. Front Immunol. 2018. PMID: 29867962 Free PMC article. Review.
-
Dendritic Cell-T-Cell Circuitry in Health and Changes in Inflammatory Bowel Disease and Its Treatment.Dig Dis. 2016;34(1-2):51-7. doi: 10.1159/000442926. Epub 2016 Mar 16. Dig Dis. 2016. PMID: 26982806 Free PMC article. Review.
-
Chemokines and Chemokine Receptors as Therapeutic Targets in Inflammatory Bowel Disease; Pitfalls and Promise.J Crohns Colitis. 2018 Aug 22;12(suppl_2):S641-S652. doi: 10.1093/ecco-jcc/jjx145. J Crohns Colitis. 2018. PMID: 30137309 Free PMC article. Review.
-
Dermal-resident versus recruited γδ T cell response to cutaneous vaccinia virus infection.J Immunol. 2015 Mar 1;194(5):2260-7. doi: 10.4049/jimmunol.1402438. Epub 2015 Jan 21. J Immunol. 2015. PMID: 25609844 Free PMC article.
-
Cutaneous manifestations of inflammatory bowel disease: basic characteristics, therapy, and potential pathophysiological associations.Front Immunol. 2023 Oct 26;14:1234535. doi: 10.3389/fimmu.2023.1234535. eCollection 2023. Front Immunol. 2023. PMID: 37954590 Free PMC article. Review.
References
-
- Tonegawa S, Berns A, Bonneville M, et al. Diversity, development, ligands, and probable functions of gamma delta T cells. Cold Spring Harbor Symposium. Quant Biol. 1989;54:31–44. - PubMed
-
- Jameson J, Ugarte K, Chen N, et al. A role for skin gammadelta T cells in wound repair. Science. 2002;296:747–9. - PubMed
-
- Boismenu R, Havran WL. Modulation of epithelial cell growth by intraepithelial gamma delta T cells. Science. 1994;266:1253–5. - PubMed
-
- Hayday A, Tigelaar R. Immunoregulation in the tissues by gammadelta T cells. Nat Rev Immunol. 2003;3:233–42. - PubMed
Publication types
MeSH terms
Substances
Grants and funding
LinkOut - more resources
Full Text Sources
Other Literature Sources
Medical
