Mitochondrial dysfunction associated with increased oxidative stress and α-synuclein accumulation in PARK2 iPSC-derived neurons and postmortem brain tissue
- PMID: 23039195
- PMCID: PMC3546866
- DOI: 10.1186/1756-6606-5-35
Mitochondrial dysfunction associated with increased oxidative stress and α-synuclein accumulation in PARK2 iPSC-derived neurons and postmortem brain tissue
Abstract
Background: Parkinson's disease (PD) is a neurodegenerative disease characterized by selective degeneration of dopaminergic neurons in the substantia nigra (SN). The familial form of PD, PARK2, is caused by mutations in the parkin gene. parkin-knockout mouse models show some abnormalities, but they do not fully recapitulate the pathophysiology of human PARK2.
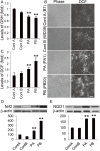
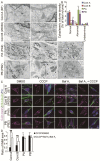
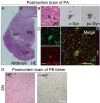
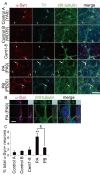
Results: Here, we generated induced pluripotent stem cells (iPSCs) from two PARK2 patients. PARK2 iPSC-derived neurons showed increased oxidative stress and enhanced activity of the nuclear factor erythroid 2-related factor 2 (Nrf2) pathway. iPSC-derived neurons, but not fibroblasts or iPSCs, exhibited abnormal mitochondrial morphology and impaired mitochondrial homeostasis. Although PARK2 patients rarely exhibit Lewy body (LB) formation with an accumulation of α-synuclein, α-synuclein accumulation was observed in the postmortem brain of one of the donor patients. This accumulation was also seen in the iPSC-derived neurons in the same patient.
Conclusions: Thus, pathogenic changes in the brain of a PARK2 patient were recapitulated using iPSC technology. These novel findings reveal mechanistic insights into the onset of PARK2 and identify novel targets for drug screening and potential modified therapies for PD.
Figures


Comment in
-
Induced pluripotent stem cells can be a useful disease model for understanding the pathomechanisms of PARK2.Mov Disord. 2013 Mar;28(3):289. doi: 10.1002/mds.25374. Epub 2013 Feb 26. Mov Disord. 2013. PMID: 23526428 No abstract available.
Similar articles
-
Induced Pluripotent Stem Cell-Derived Dopaminergic Neurons from Familial Parkinson's Disease Patients Display α-Synuclein Pathology and Abnormal Mitochondrial Morphology.Cells. 2021 Sep 13;10(9):2402. doi: 10.3390/cells10092402. Cells. 2021. PMID: 34572052 Free PMC article.
-
Parkin and PINK1 Patient iPSC-Derived Midbrain Dopamine Neurons Exhibit Mitochondrial Dysfunction and α-Synuclein Accumulation.Stem Cell Reports. 2016 Oct 11;7(4):664-677. doi: 10.1016/j.stemcr.2016.08.012. Epub 2016 Sep 15. Stem Cell Reports. 2016. PMID: 27641647 Free PMC article.
-
Identification of bioactive metabolites in human iPSC-derived dopaminergic neurons with PARK2 mutation: Altered mitochondrial and energy metabolism.Stem Cell Reports. 2021 Jun 8;16(6):1510-1526. doi: 10.1016/j.stemcr.2021.04.022. Epub 2021 May 27. Stem Cell Reports. 2021. PMID: 34048689 Free PMC article.
-
Reprint of: revisiting oxidative stress and mitochondrial dysfunction in the pathogenesis of Parkinson disease-resemblance to the effect of amphetamine drugs of abuse.Free Radic Biol Med. 2013 Sep;62:186-201. doi: 10.1016/j.freeradbiomed.2013.05.042. Epub 2013 Jun 3. Free Radic Biol Med. 2013. PMID: 23743292 Review.
-
Interaction between Parkin and α-Synuclein in PARK2-Mediated Parkinson's Disease.Cells. 2021 Jan 31;10(2):283. doi: 10.3390/cells10020283. Cells. 2021. PMID: 33572534 Free PMC article. Review.
Cited by
-
Modelling Parkinson's Disease: iPSCs towards Better Understanding of Human Pathology.Brain Sci. 2021 Mar 14;11(3):373. doi: 10.3390/brainsci11030373. Brain Sci. 2021. PMID: 33799491 Free PMC article. Review.
-
A human Dravet syndrome model from patient induced pluripotent stem cells.Mol Brain. 2013 May 2;6:19. doi: 10.1186/1756-6606-6-19. Mol Brain. 2013. PMID: 23639079 Free PMC article.
-
Pluripotent Stem Cell Derived Neurons as In Vitro Models for Studying Autosomal Recessive Parkinson's Disease (ARPD): PLA2G6 and Other Gene Loci.Adv Exp Med Biol. 2021;1347:115-133. doi: 10.1007/5584_2021_643. Adv Exp Med Biol. 2021. PMID: 33990932 Free PMC article.
-
Using Patient-Derived Induced Pluripotent Stem Cells to Identify Parkinson's Disease-Relevant Phenotypes.Curr Neurol Neurosci Rep. 2018 Oct 4;18(12):84. doi: 10.1007/s11910-018-0893-8. Curr Neurol Neurosci Rep. 2018. PMID: 30284665 Free PMC article. Review.
-
Basic Concepts on the Role of Nuclear Factor Erythroid-Derived 2-Like 2 (Nrf2) in Age-Related Diseases.Int J Mol Sci. 2019 Jun 29;20(13):3208. doi: 10.3390/ijms20133208. Int J Mol Sci. 2019. PMID: 31261912 Free PMC article. Review.
References
-
- Farrer MJ. Genetics of Parkinson disease: paradigm shifts and future prospects. Nature reviews. 2006;7:306–318. - PubMed
Publication types
MeSH terms
Substances
LinkOut - more resources
Full Text Sources
Medical
Research Materials

