. 2012 Oct 3;32(40):13819-40.
doi: 10.1523/JNEUROSCI.2601-12.2012.

Optimization of a GCaMP calcium indicator for neural activity imaging

Affiliations

Optimization of a GCaMP calcium indicator for neural activity imaging

Jasper Akerboom et al. J Neurosci. .

Abstract

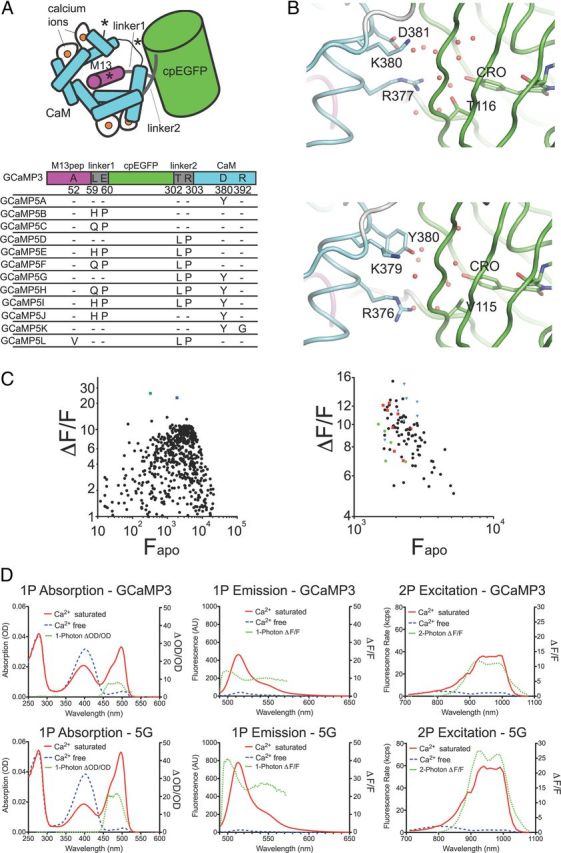
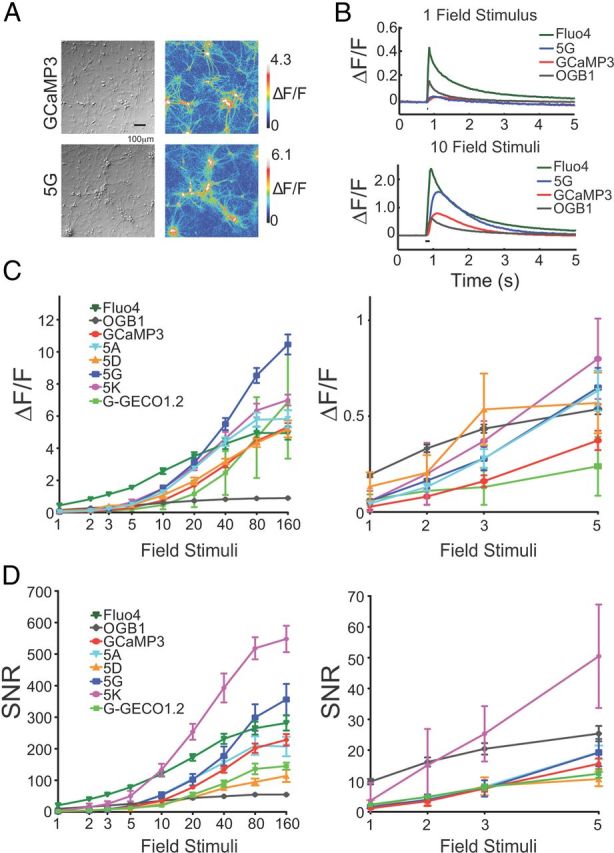
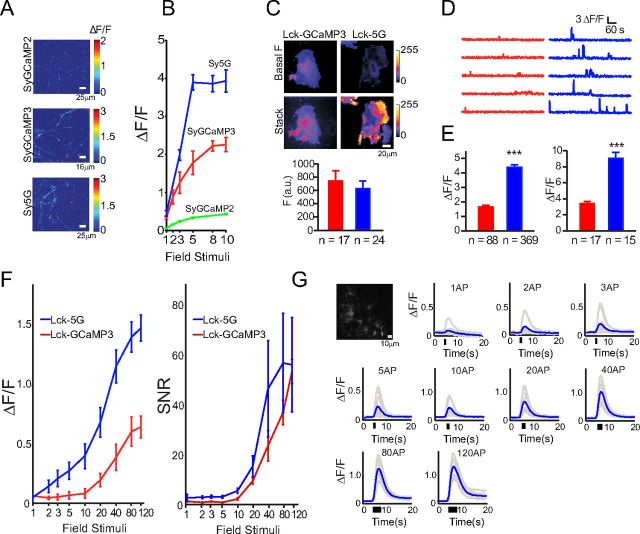
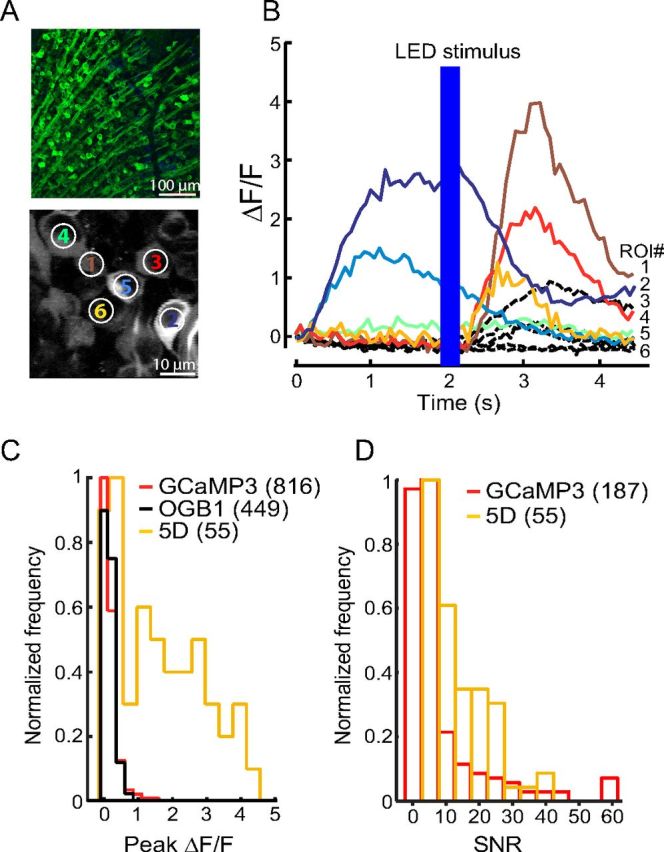
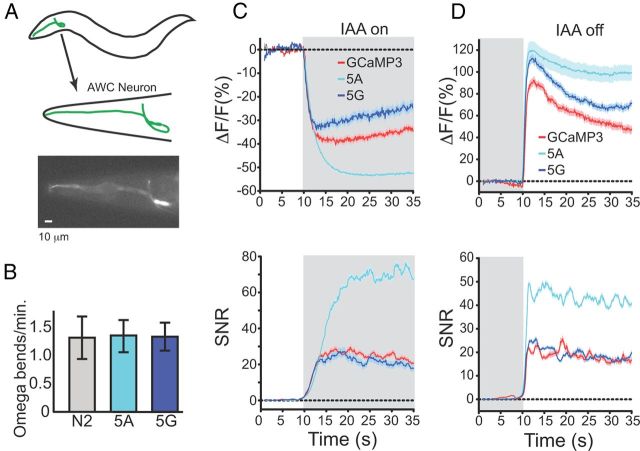
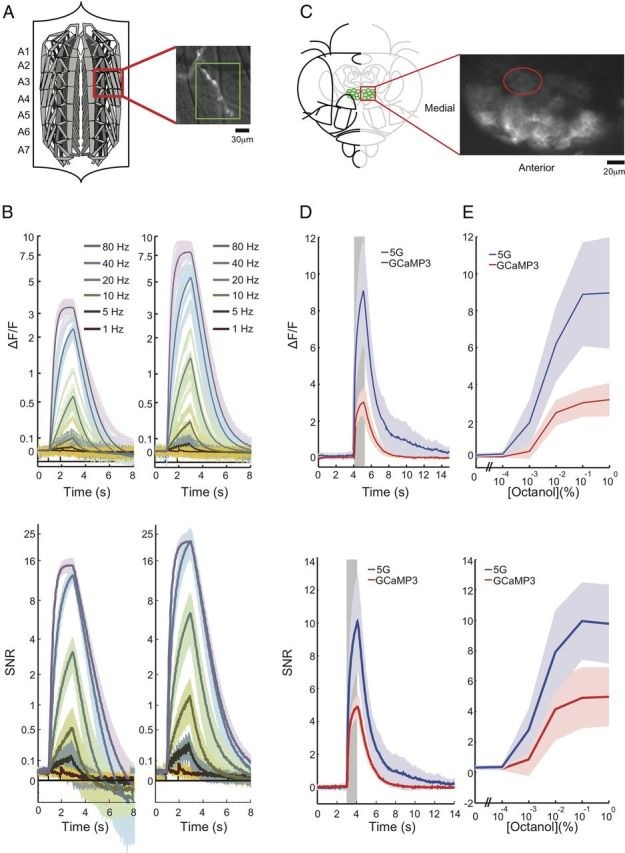
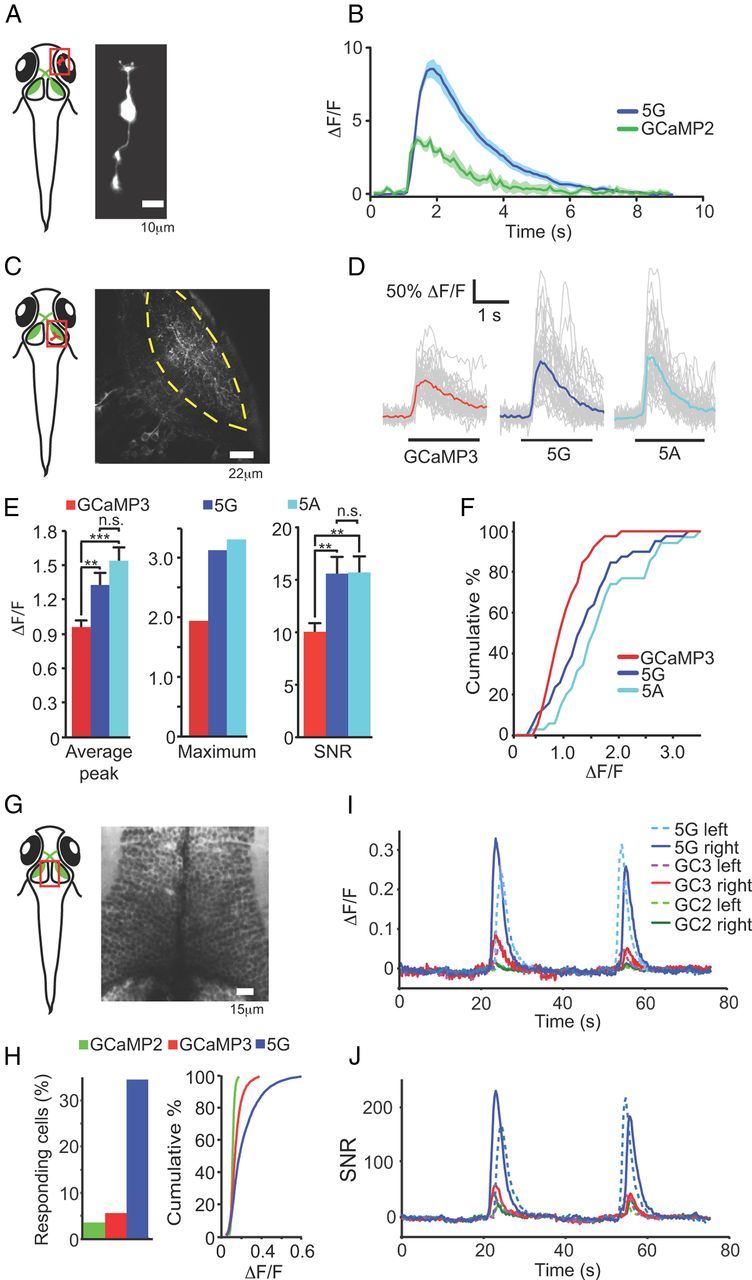
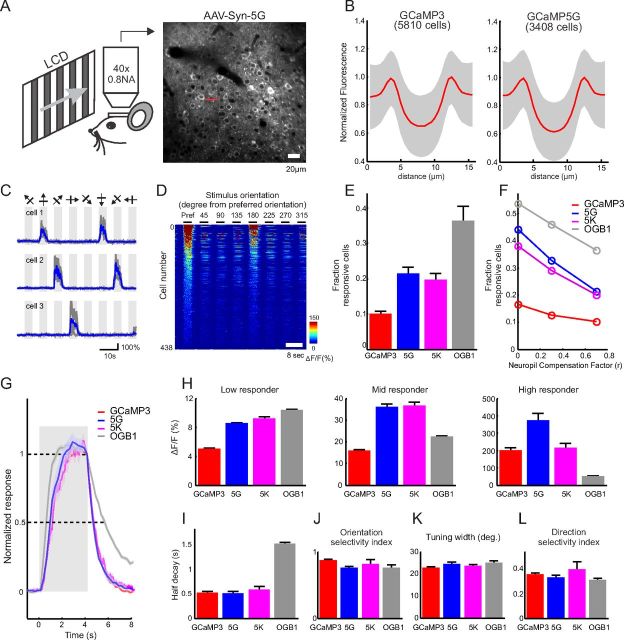
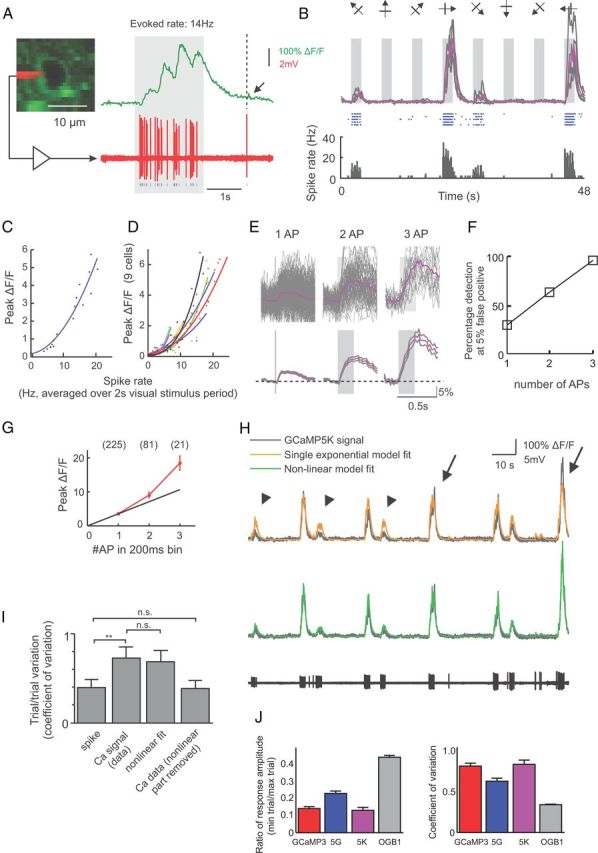
Genetically encoded calcium indicators (GECIs) are powerful tools for systems neuroscience. Recent efforts in protein engineering have significantly increased the performance of GECIs. The state-of-the art single-wavelength GECI, GCaMP3, has been deployed in a number of model organisms and can reliably detect three or more action potentials in short bursts in several systems in vivo. Through protein structure determination, targeted mutagenesis, high-throughput screening, and a battery of in vitro assays, we have increased the dynamic range of GCaMP3 by severalfold, creating a family of "GCaMP5" sensors. We tested GCaMP5s in several systems: cultured neurons and astrocytes, mouse retina, and in vivo in Caenorhabditis chemosensory neurons, Drosophila larval neuromuscular junction and adult antennal lobe, zebrafish retina and tectum, and mouse visual cortex. Signal-to-noise ratio was improved by at least 2- to 3-fold. In the visual cortex, two GCaMP5 variants detected twice as many visual stimulus-responsive cells as GCaMP3. By combining in vivo imaging with electrophysiology we show that GCaMP5 fluorescence provides a more reliable measure of neuronal activity than its predecessor GCaMP3. GCaMP5 allows more sensitive detection of neural activity in vivo and may find widespread applications for cellular imaging in general.


Figures

Figure 1.
Figure 1.
Design of GCaMP5s. A, Schematic of the GCaMP3 structure with sites of engineering shown. B, Structural effects of the D381Y mutation (D380Y in GCaMP3 numbering). Chromophore environment at the cpGFP/CaM interface in GCaMP2 (top, PDB 3EVR)(Akerboom et al., 2009) and GCaMP5G (bottom, PDB 3SG4) structure reported here. Structures are shown as a diagram and sticks colored by domain (cpGFP, green; linker, white; CaM, cyan). Selected portions of the model around the GFP chromophore (CRO) are represented as sticks with ordered water molecules represented as red spheres. C, (ΔF/F)max versus Fapo for both linker 1 variants of GCaMP3 (left) and linker 2 variants of GCaMP3 (right) in bacterial lysate. Left, The green square denotes L1-Gln-Pro, the blue square denotes L1-His-Pro. Right, Linker variants L2-Pro-X are depicted as red squares, L2-X-Pro as blue triangles, and original GCaMP3 linker variants (L2-Thr-Arg) as green dots. D, One-photon absorption (left), one-photon emission (middle), and two-photon excitation (right) spectra of both GCaMP3 (top) and GCaMP5G (bottom). Calcium-free spectra are depicted by dashed blue lines and calcium-saturated spectra by solid red lines. Dashed green lines depict (ΔF/F)max, plotted on the right axis.
Figure 2.
Figure 2.
Neuronal testing of GCaMP5s. A, GCaMP3 and 5G responses in neurons. DIC (left) and false-colored image of fluorescence response to 40 field stimuli (right). B, Trial-averaged responses of GCaMP3 and 5G, and OGB-1 and Fluo-4, to 1 and 10 field stimuli. C, Peak ΔF/F versus stimuli. Error bars indicate SEM. Right, blow-up of 1–5 stimuli. D, SNR including SEM. SNR was computed as the ratio between the peak fluorescence response amplitude (ΔF) and the SD of the fluorescence trace before stimulus onset. Fluo-4 was omitted from the blow-ups.
Figure 3.
Figure 3.
Targeted GCaMP5s and astrocyte testing. A, Heat map showing peak ΔF/F of hippocampal neurons transfected with SyGCaMP5s following 10 field stimuli (20 Hz). B, Fluorescence response versus field stimuli for SyGCaMPs. C–E, Performance of LckGCaMPs in astrocytes. C, Top, Baseline fluorescence of LckGCaMP3 and 5G. Middle, Spotty calcium signals. Bottom, Quantified baseline fluorescence: red, GCaMP3; blue, GCaMP5G. D, Spotty calcium transients for LckGCaMP3 and Lck-GCaMP5G, respectively. E, Peak ΔF/F for spontaneous (left) and ATP-evoked (right) responses in astrocytes. F, Peak ΔF/F for neuronal AP-evoked astrocyte responses. Error bars indicate SEM. G, Fluorescence micrograph of GFAP-GCaMP5G-transfected astrocytes and fluorescence response of GFAP-GCaMP5G to field stimulation (30 Hz) of cocultured neurons; 1–120 field stimulations. Raw traces in gray, trial-average in blue.
Figure 4.
Figure 4.
GCaMP5D in mouse retina. A, Top, Fluorescence micrograph of retinal ganglion cells (RGCs) expressing GCaMP5D. Bottom, Two-photon fluorescence image of RGCs expressing GCaMP5D. B, Fluorescence response of six indicated RGCs to infrared scan laser onset and to full-field blue LED flash. Black dashed lines show responses of a representative population of GCaMP3-labeled RGCs recorded under identical stimulus conditions (data replotted from Borghuis et al., 2011). C, Peak ΔF/F distribution for 55 imaged RGCs. Corresponding data for GCaMP3 and OGB-1 labeled neuron populations are shown in red and black, respectively (data reproduced from Borghuis et al., 2011). D, SNR distribution of GCaMP3 and GCaMP5D.
Figure 5.
Figure 5.
GCaMPs in C. elegans AWCon neuron in response to odor addition and removal. A, Schematic of AWC neuron location, and fluorescence micrograph of corresponding view. Scale bar, 10 μm. B, Omega bending frequency of wild-type C. elegans (N2) and 5A and 5G animals. C, Odor addition-evoked Ca2+ transients. Top, ΔF/F (%). Bottom, SNR. D, Odor removal-evoked Ca2+ transients. For both C and D, trial-averaged responses are colored red, blue, and cyan for GCaMP3, GCaMP5G, and 5A, respectively. Shaded area represents odor presence. Error traces indicate SEM.
Figure 6.
Figure 6.
GCaMPs in Drosophila. A, Schematic of larval NMJ preparation, and close-up of Type 1b boutons from muscle 13 (segments A3–A5) used for wide-field imaging. Scale bar, 30 μm. B, Single trials of electrically evoked Ca2+ transients from wide-field imaging in the Drosophila larval NMJ. Top: Fluorescence changes (ΔF/F) traces from presynaptic terminals obtained by delivering 2 s of electrical stimulus at different frequencies. Bottom: SNR of the same data. Left, GCaMP3. Right, GCaMP5G. C, Two-photon imaging frame scan of PNs innervating the DC1 glomerulus in the adult fly AL (dorsal view) Scale bar, 20 μm. D, The mean of five replicate stimulations from six ALs (5 animals) is shown along with the SD (between AL means). Response to a 0.1% octanol, 1 s odor pulse from DC1 PNs. E, Mean octanol response from PNs from DC1 glomerulus (averaged over 5 flies) to increasing concentration. All panels show mean ± SD.
Figure 7.
Figure 7.
In vivo imaging in zebrafish. A, Schematic representation of area imaged (red square; retinal bipolar cell terminals) including fluorescence micrograph of bipolar cell. B, Two-photon imaging of calcium spikes in axon terminals of retinal bipolar cells in Tg(Ribeye-A:GCaMP2) (green line) and Tg(Ribeye-A:GCaMP5G) (blue line) fish. Mean (± SEM) of 20 spontaneous calcium spikes plotted. C, Schematic of tectal neuropil imaged in zebrafish (red square). Micrograph with dashed yellow lines marking the borders of the tectal neuropil. D, Imaging Ca2+ transients in RGC axons and tectal neuron dendrites in GCaMP3, 5A, and 5G fish. Single-trial (gray) and trial-average (GCaMP3, red; 5A, cyan; 5G, blue) ΔF/F traces recorded during 2 s visual stimulation to contralateral eye (black bars below traces); stimulus bar moves through the receptive field of the imaged neurons, and is unlikely to be visible to the imaged neuron for the entire 2 s. E, Histograms depicting average (ΔF/F)max values (left), maximum (middle) (ΔF/F)max values, and SNR (right), over the neurons analyzed. Error bars indicate SEM, **p < 0.01, ***p < 0.001, n.s., not significant; two-tailed t test. F, Cumulative distributions of amplitudes of visually evoked calcium transients: p = 0.03 for 5G, p < 0.001 for 5A (compared with GCaMP3); two-sample Kolmogorov–Smirnov test. For all experiments n ≥ 35 calcium transients recorded in ≥3 larvae. G, Schematic of two-photon imaged location [optic tectum somata of Tg(elavl3:GCaMP2, 3, and 5G) fish] including micrograph. H, Left, Fraction of cells with detectable response (for 5G vs GCaMP3: paired t test, one-tailed p < 0.01). Right, Cumulative histogram of peak ΔF/F values. I, Trial-averaged (n = 11, 9, and 9 animals for GCaMP2, GCaMP3, and GCaMP5G, respectively) responses to visual stimuli of top 50% of responding cells, ranked by peak ΔF/F. J, SNR of trial-averaged responses. Cell traces were divided by the SD of 10 s preceding visual response. The average of this SNR trace for each indicator is plotted.
Figure 8.
Figure 8.
Comparing 5G and 5K with GCaMP3 and OGB-1 in mouse visual cortex. A, Left, Schematic showing experimental setup. Right, GCaMP5G expression in layer 2/3 neurons of V1 3 weeks following AAV injection. B, Normalized fluorescence intensity along a line through the center of a cell (red line in A, right). Mean in red and standard deviation in gray. C, Responses of three cells to eight oriented moving grating stimuli; gray, single trials, blue, trial-average. D, Visual responses ((ΔF/F)max) of 438 responsive cells, rank ordered by signal level, to eight orientations aligned in columns starting with the preferred orientation. E, Fraction of visually responsive neurons (GCaMP3, 10.2%; 5G, 21.5%; 5K, 20.6%; OGB-1, 36.5%; neuropil compensation factor r = 0.7). F, Fraction of responsive neurons as a function of the strength of neuropil compensation applied. G, Averaged visually evoked calcium transients of the 10% most responsive cells at their preferred orientations, normalized to the end of the stimulus period. H, Average ΔF/F at the preferred orientation for low responder (50–80th percentile), mid responder (80–97th percentile), and high responder (>97th percentile) cells. I, Fluorescence half-decay time after stimulus offset (quantified for the 10% most responsive cells at preferred orientation). GCaMP3 (520 ± 430 ms, median ± SD), 5G (510 ± 500 ms), 5K (570 ± 580 ms), OGB-1 (1510 ± 460 ms); p = 0.73 (3 vs 5G), 0.045 (3 vs 5K), 0.083 (5G vs 5K), (p < 10−23, GCaMPs vs OGB-1; Wilcoxon signed rank sum test). J, OSI. GCaMP3, 0.87 ± 0.05; 5G, 0.76 ± 0.06; 5K, 0.82 ± 0.11; OGB-1, 0.75 ± 0.08; ANOVA1, p = 0.03. K, Tuning width. GCaMP3, 23 ± 1; 5G, 25 ± 2; 5K, 24 ± 1; OGB-1, 25 ± 1; ANOVA1, p = 0.11. L, DSI. GCaMP3, 0.35 ± 0.03; 5G, 0.33 ± 0.04; 5K, 0.4 ± 0.1; OGB, 0.3 ± 0.02; ANOVA1, p = 0.15. Error bars indicate SEM.
Figure 9.
Figure 9.
Relationship between spiking and 5K signal in vivo. A, Visually evoked 5K response (top) and simultaneously recorded spikes (bottom) in a layer 2/3 pyramidal cell in V1. Arrow, Putative single spike-induced signal. B, 5K responses (top: gray, individual trials; purple, average of 5 trials) and corresponding spike raster (middle) and peristimulus time histogram (bottom) during the presentation of eight oriented grating stimuli. C, Peak GCaMP5K response during 2 s visual stimulation as a function of spike rate. D, Peak GCaMP5K response plotted against spike rate for nine cells. E, Average GCaMP5K response to 1, 2, and 3 APs within 200 ms search windows. Gray traces are mean ± SEM (n = 225, 81, and 21 for 1, 2, and 3 APs, respectively). F, Spike detection efficiency. G, Peak ΔF/F response to 1, 2, and 3 APs. H, Single exponential model (yellow trace) and nonlinear model (green trace) fit of the GCaMP5K signal (gray) from the simultaneously recorded spike response (black trace, bottom). Arrows, Underestimation of large events. Arrowheads, Overestimation of small events by the single exponential model. I, Trial-to-trial variability of GCaMP5K (coefficient of variation) during repeated presentation of preferred stimuli calculated using different measures. (**p = 0.0012; n.s., nonsignificant; n = 7 cells). J, Trial-to-trial variability of fluorescent responses at preferred orientation quantified for all visually responsive neurons, for all four calcium indicators.

Similar articles

Cited by

References

    1. Aberle H, Haghighi AP, Fetter RD, McCabe BD, Magalhães TR, Goodman CS. wishful thinking encodes a BMP type II receptor that regulates synaptic growth in Drosophila. Neuron. 2002;33:545–558. - PubMed
    1. Akerboom J, Rivera JD, Guilbe MM, Malavé EC, Hernandez HH, Tian L, Hires SA, Marvin JS, Looger LL, Schreiter ER. Crystal structures of the GCaMP calcium sensor reveal the mechanism of fluorescence signal change and aid rational design. J Biol Chem. 2009;284:6455–6464. - PMC - PubMed
    1. Alicea I, Marvin JS, Miklos AE, Ellington AD, Looger LL, Schreiter ER. Structure of the Escherichia coli phosphonate binding protein PhnD and rationally optimized phosphonate biosensors. J Mol Biol. 2011;414:356–369. - PMC - PubMed
    1. Borghuis BG, Tian L, Xu Y, Nikonov SS, Vardi N, Zemelman BV, Looger LL. Imaging light responses of targeted neuron populations in the rodent retina. J Neurosci. 2011;31:2855–2867. - PMC - PubMed
    1. Brainard DH. The Psychophysics Toolbox. Spat Vis. 1997;10:433–436. - PubMed

Publication types

MeSH terms