MiRmap: comprehensive prediction of microRNA target repression strength
- PMID: 23034802
- PMCID: PMC3526310
- DOI: 10.1093/nar/gks901
MiRmap: comprehensive prediction of microRNA target repression strength
Abstract
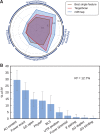
MicroRNAs, or miRNAs, post-transcriptionally repress the expression of protein-coding genes. The human genome encodes over 1000 miRNA genes that collectively target the majority of messenger RNAs (mRNAs). Base pairing of the so-called miRNA 'seed' region with mRNAs identifies many thousands of putative targets. Evaluating the strength of the resulting mRNA repression remains challenging, but is essential for a biologically informative ranking of potential miRNA targets. To address these challenges, predictors may use thermodynamic, evolutionary, probabilistic or sequence-based features. We developed an open-source software library, miRmap, which for the first time comprehensively covers all four approaches using 11 predictor features, 3 of which are novel. This allowed us to examine feature correlations and to compare their predictive power in an unbiased way using high-throughput experimental data from immunopurification, transcriptomics, proteomics and polysome fractionation experiments. Overall, target site accessibility appears to be the most predictive feature. Our novel feature based on PhyloP, which evaluates the significance of negative selection, is the best performing predictor in the evolutionary category. We combined all the features into an integrated model that almost doubles the predictive power of TargetScan. miRmap is freely available from http://cegg.unige.ch/mirmap.
Figures


Similar articles
-
miRmap web: Comprehensive microRNA target prediction online.Nucleic Acids Res. 2013 Jul;41(Web Server issue):W165-8. doi: 10.1093/nar/gkt430. Epub 2013 May 28. Nucleic Acids Res. 2013. PMID: 23716633 Free PMC article.
-
The Limitations of Existing Approaches in Improving MicroRNA Target Prediction Accuracy.Methods Mol Biol. 2017;1617:133-158. doi: 10.1007/978-1-4939-7046-9_10. Methods Mol Biol. 2017. PMID: 28540682
-
Computational Prediction of MicroRNA Target Genes, Target Prediction Databases, and Web Resources.Methods Mol Biol. 2017;1617:109-122. doi: 10.1007/978-1-4939-7046-9_8. Methods Mol Biol. 2017. PMID: 28540680 Review.
-
STarMir Tools for Prediction of microRNA Binding Sites.Methods Mol Biol. 2016;1490:73-82. doi: 10.1007/978-1-4939-6433-8_6. Methods Mol Biol. 2016. PMID: 27665594 Free PMC article.
-
IsomiRs: Expanding the miRNA repression toolbox beyond the seed.Biochim Biophys Acta Gene Regul Mech. 2020 Apr;1863(4):194373. doi: 10.1016/j.bbagrm.2019.03.005. Epub 2019 Apr 4. Biochim Biophys Acta Gene Regul Mech. 2020. PMID: 30953728 Free PMC article. Review.
Cited by
-
Conjunctival MicroRNA expression in inflammatory trachomatous scarring.PLoS Negl Trop Dis. 2013;7(3):e2117. doi: 10.1371/journal.pntd.0002117. Epub 2013 Mar 14. PLoS Negl Trop Dis. 2013. PMID: 23516655 Free PMC article.
-
Extracellular Vesicle MicroRNA in Malignant Pleural Effusion.Genes (Basel). 2022 Nov 19;13(11):2159. doi: 10.3390/genes13112159. Genes (Basel). 2022. PMID: 36421832 Free PMC article.
-
Effects of microRNA-298 on APP and BACE1 translation differ according to cell type and 3'-UTR variation.Sci Rep. 2022 Feb 23;12(1):3074. doi: 10.1038/s41598-022-05164-4. Sci Rep. 2022. PMID: 35197498 Free PMC article.
-
MiR-509-3p is oncogenic, targets the tumor suppressor PHLPP2, and functions as a novel tumor adjacent normal tissue based prognostic biomarker in colorectal cancer.BMC Cancer. 2022 Mar 31;22(1):351. doi: 10.1186/s12885-021-09075-x. BMC Cancer. 2022. PMID: 35361144 Free PMC article.
-
Systematic Analysis of Transcriptomic Profile of the Effects of Low Dose Atropine Treatment on Scleral Fibroblasts using Next-Generation Sequencing and Bioinformatics.Int J Med Sci. 2019 Nov 9;16(12):1652-1667. doi: 10.7150/ijms.38571. eCollection 2019. Int J Med Sci. 2019. PMID: 31839753 Free PMC article.
References
-
- Didiano D, Hobert O. Perfect seed pairing is not a generally reliable predictor for miRNA-target interactions. Nat. Struct. Mol. Biol. 2006;13:849–851. - PubMed
Publication types
MeSH terms
Substances
LinkOut - more resources
Full Text Sources
Other Literature Sources
Molecular Biology Databases

