. 2012;7(9):e45844.
doi: 10.1371/journal.pone.0045844. Epub 2012 Sep 20.

Specific silencing of the REST target genes in insulin-secreting cells uncovers their participation in beta cell survival

Affiliations

Specific silencing of the REST target genes in insulin-secreting cells uncovers their participation in beta cell survival

David Martin et al. PLoS One. 2012.

Abstract

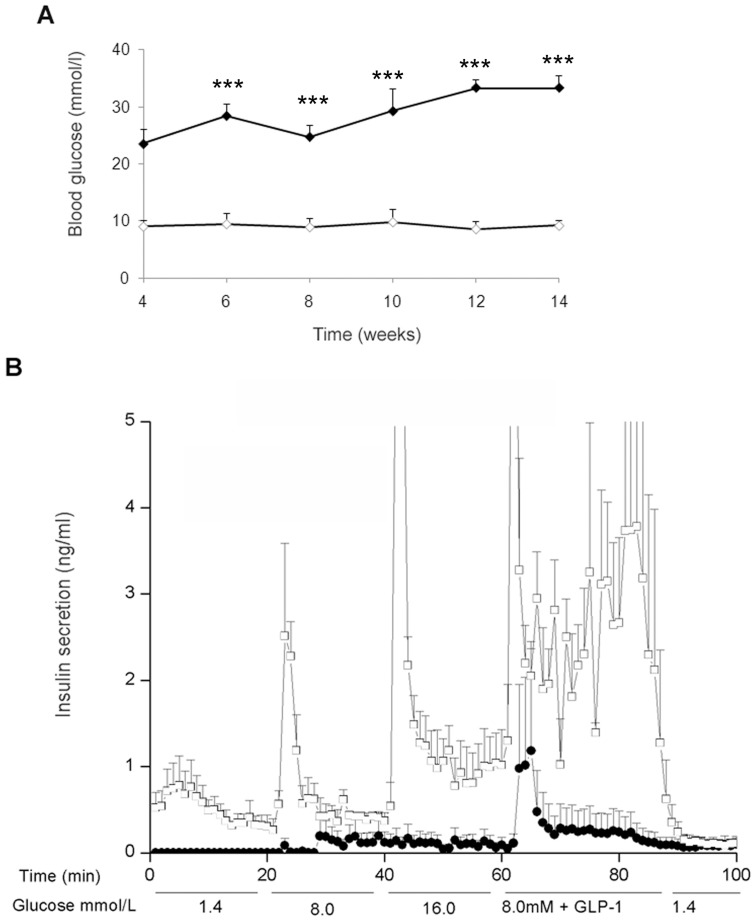
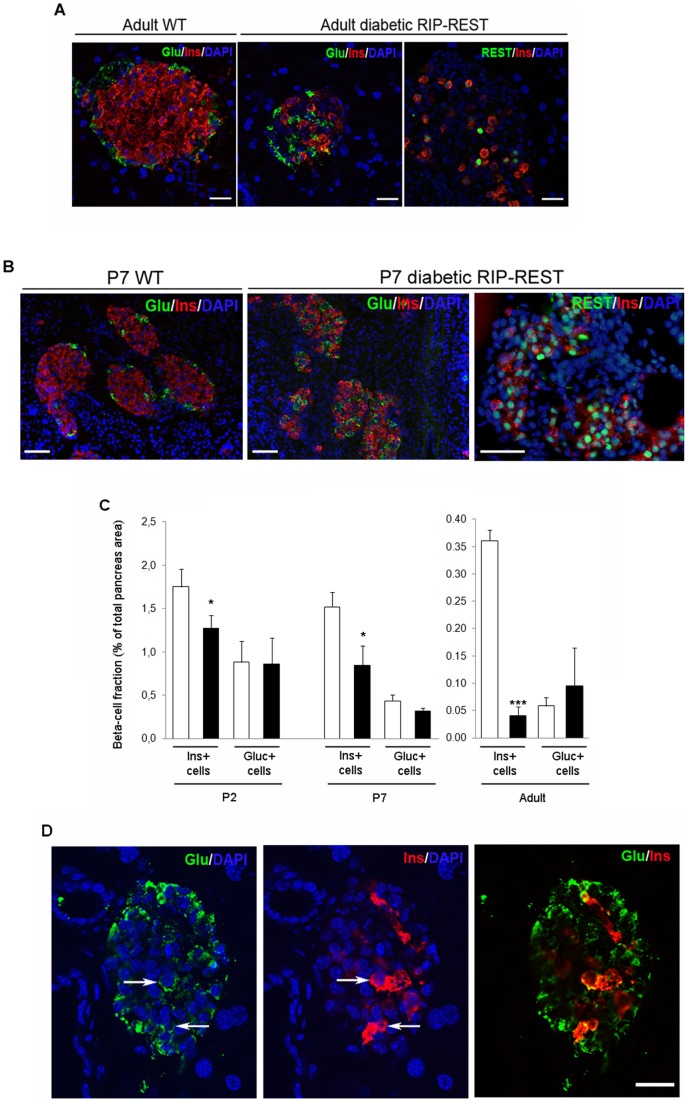
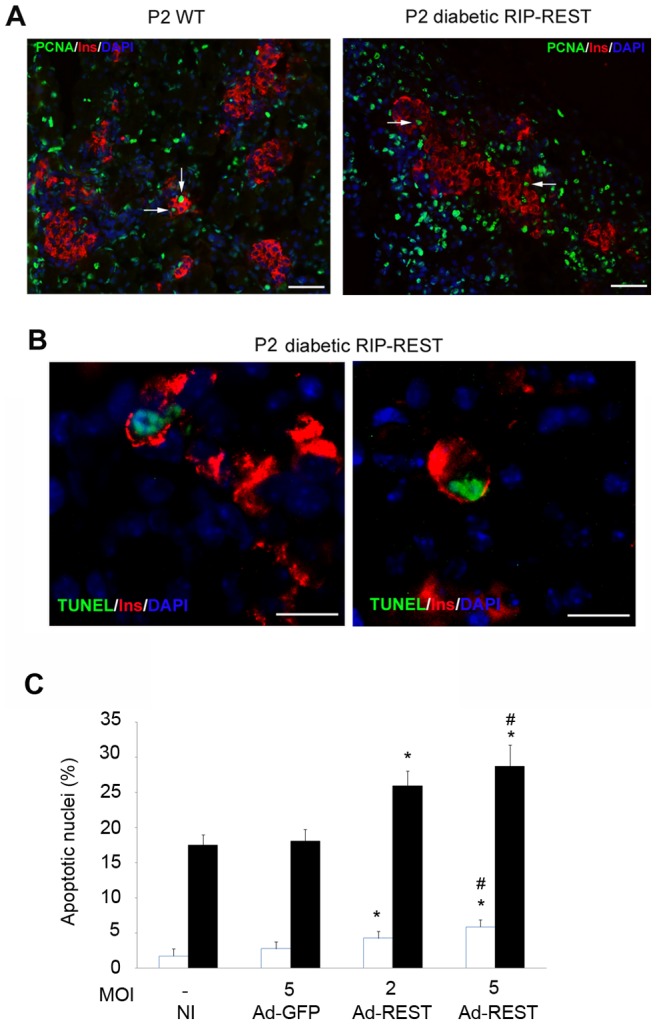
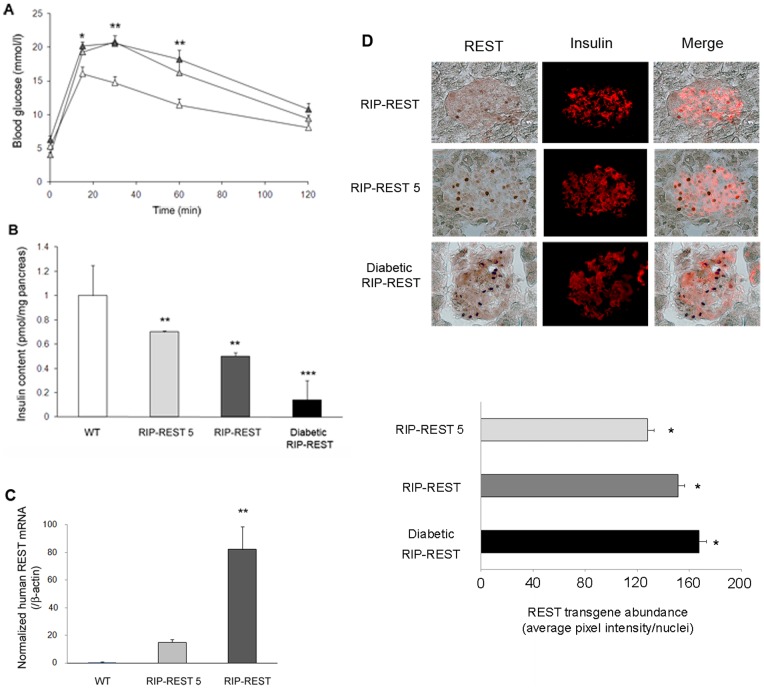
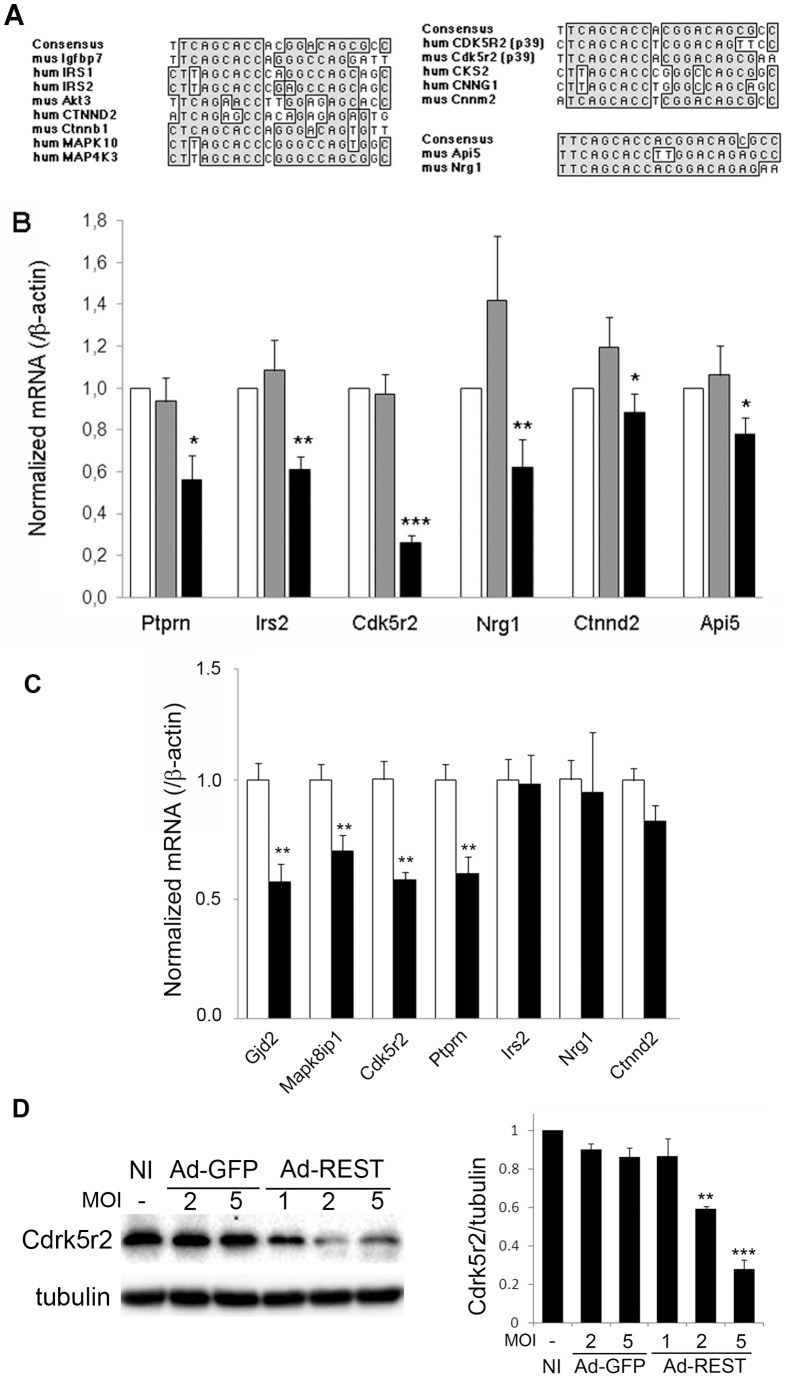
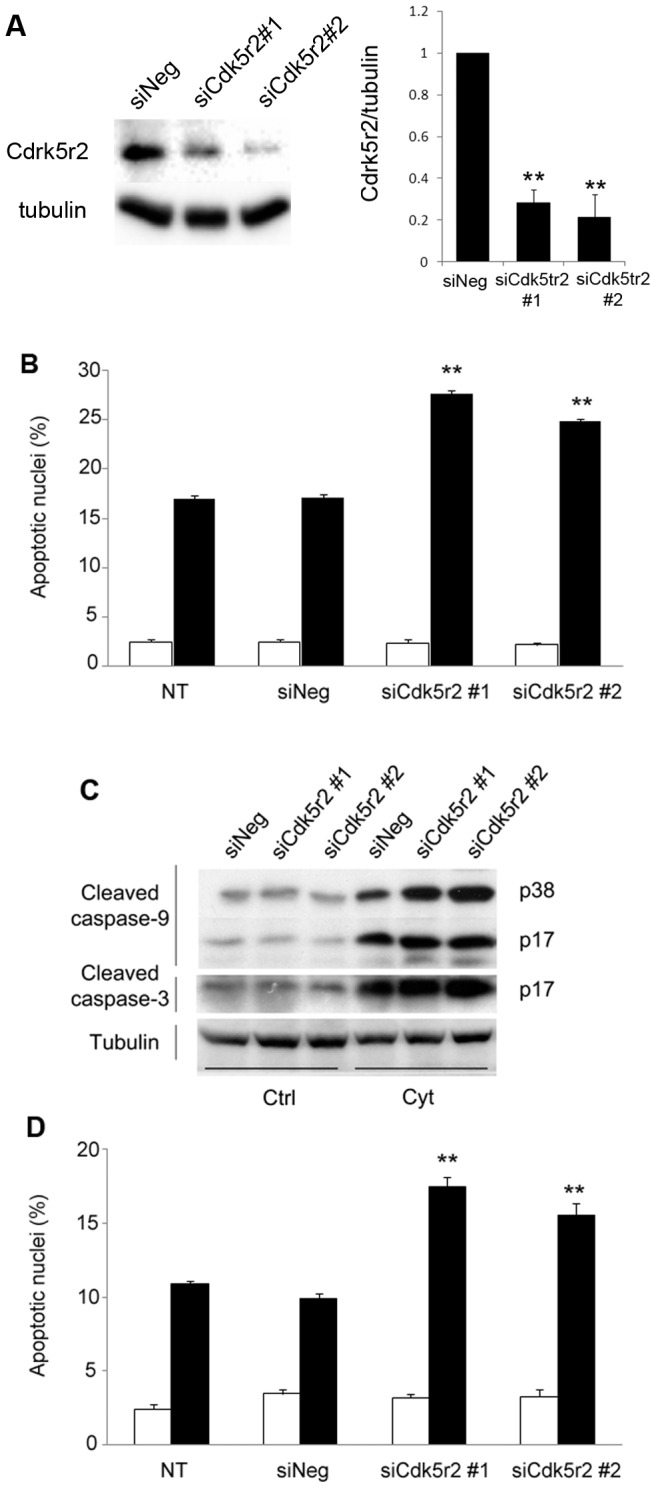
The absence of the transcriptional repressor RE-1 Silencing Transcription Factor (REST) in insulin-secreting beta cells is a major cue for the specific expression of a large number of genes. These REST target genes were largely ascribed to a function of neurotransmission in a neuronal context, whereas their role in pancreatic beta cells has been poorly explored. To identify their functional significance, we have generated transgenic mice expressing REST in beta cells (RIP-REST mice), and previously discovered that REST target genes are essential to insulin exocytosis. Herein we characterized a novel line of RIP-REST mice featuring diabetes. In diabetic RIP-REST mice, high levels of REST were associated with postnatal beta cell apoptosis, which resulted in gradual beta cell loss and sustained hyperglycemia in adults. Moreover, adenoviral REST transduction in INS-1E cells led to increased cell death under control conditions, and sensitized cells to death induced by cytokines. Screening for REST target genes identified several anti-apoptotic genes bearing the binding motif RE-1 that were downregulated upon REST expression in INS-1E cells, including Gjd2, Mapk8ip1, Irs2, Ptprn, and Cdk5r2. Decreased levels of Cdk5r2 in beta cells of RIP-REST mice further confirmed that it is controlled by REST, in vivo. Using siRNA-mediated knock-down in INS-1E cells, we showed that Cdk5r2 protects beta cells against cytokines and palmitate-induced apoptosis. Together, these data document that a set of REST target genes, including Cdk5r2, is important for beta cell survival.


Conflict of interest statement

Competing Interests: The authors have declared that no competing interests exist.

Figures

Figure 1
Figure 1. Diabetic RIP-REST transgenic mice are hyperglycemic and show poor insulin secretion.
A. Blood glucose levels were assessed at different ages in male and female diabetic RIP-REST transgenic (dark diamonds; n = 7) and wild type mice (open diamonds; n = 5). Diabetic RIP-REST mice feature hyperglycemia from weaning onward. Results are mean ± SD. ***P<0.001 versus values of wild type mice. B. Diabetic RIP-REST mice (black circles, n = 3) and wild type littermates (open squares, n = 4) were subjected to in situ pancreatic perfusion at 1.5 ml/min rate. After a 30-min equilibration period at basal 1.4 mmol/l glucose, the pancreas was perfused sequentially at different glucose concentrations, first at 1.4 mmol/l for 20 min, next at 8.0 mmol/l for 20 min, then at 16.0 mmol/l for 20 min, followed by a 30-min stimulation at 8.0 mmol/l plus 1 nmol/l GLP-1, and finally at 1.4 mmol/l for 15 min. Results are mean ± SD.
Figure 2
Figure 2. REST expression is associated with a major loss of beta cell mass.
A. Immunostaining for insulin (Ins, red) and glucagon (Glu, green) reveals, when compared to wild type mice (WT, left panel), a major loss of insulin-positive cells, within a low number of disorganized islets in pancreas of adult diabetic RIP-REST mice (middle panel). REST nuclear staining (green, right panel) indicates that only a few surviving beta cells still express REST. Blue staining is the DAPI labeling of nuclei. Scale bar, 25 μm. B. Immunostaining for insulin (Ins, red) and glucagon (Glu, green) shows that, even if disorganized when compared to islets from wild type animals (WT, left panel), islets from diabetic RIP-REST mice at postnatal day 7 (P7) show a significant number of insulin-positive cells (middle panel). REST nuclear staining (green, right panel) indicates that a majority of beta cells express REST. Blue staining is the DAPI labeling of nuclei. Scale bar, 50 μm. C. Quantification of beta-(Ins+ cells) and alpha- (Gluc+ cells) cell mass in P2, P7 and adult diabetic RIP-REST (black bars, n = 3 each) and wild type mice (white bars, n = 3 each). A 30, 45 and 90% reduction in beta cell mass is observed in P2, P7, and adult diabetic RIP-REST mice, respectively, when compared with corresponding mass of controls. Results are mean ± SD. *P<0.05, ***P<0.001 versus values of wild type mice. D. Confocal analysis of insulin (Ins, red) and glucagon (Glu, green) immunofluorescence shows scarce double insulin-and glucagon-expressing cells (arrows) in pancreatic sections of adult diabetic RIP-REST mice. Blue staining is the DAPI labeling of nuclei. Scale bar, 25 μm.
Figure 3
Figure 3. Beta cell loss in diabetic RIP-REST mice occurs through apoptosis.
A. Nuclear PCNA (green) and insulin (red) staining show same level of proliferating beta cells (arrows) in both wild type (WT, left panel) and diabetic RIP-REST mice (right panel) at P2. Blue staining is the DAPI labeling of nuclei. Scale bar, 50 μm. B. Representative images of nuclear TUNEL (green) and insulin (red) staining showing apoptotic nuclei of beta cells in sections of P2 diabetic RIP-REST mice. No apoptotic beta cells were detected in wild type animals (not shown). Blue staining is the DAPI labeling of nuclei. Scale bar, 25 μm. C. Quantification of apoptotic nuclei in non-infected INS-1E cells (NI) and INS-1E cells transfected with a control (Ad-GFP) or REST-expressing adenovirus (Ad-REST) at different multiplicity of infection (MOI) as indicated, and treated 24 h with a mix of cytokines (black bars) or not (white bars). Results are mean ± SD of six independent experiments. *P<0.05 versus respective controls in treated or untreated conditions. # P<0.05 versus MOI 2 of Ad-REST infection.
Figure 4
Figure 4. Increasing REST levels in beta cells lead to worsened glucose homeostasis.
A. Blood glucose levels in 6 month-old wild type (open triangles; n = 8), RIP-REST 5 (gray triangles; n = 8) and RIP-REST males (dark triangles; n = 10) during an IPGTT. After a 14 h fasting, blood samples were taken before (t = 0) and after (t = 15, 30, 60 and 120 min) intraperitoneal injection of glucose (2 g/kg). Results are mean ± SD. *P<0.05, **P<0.01. B. Insulin content in pancreas of 5 month-old RIP-REST 5 (light gray bar; n = 8), RIP-REST (dark gray bar; n = 6) and diabetic RIP-REST (black bar; n = 6) transgenic mice reveal a 30, 50 and 85% reduction, respectively, when compared with wild type mice (white bars, n = 6). Results are mean ± SD. **P<0.01, ***P<0.001 versus values of wild type animals. C. Quantitative RT-PCR analysis of human REST mRNA levels in islets of 5 month-old WT (white bar; n = 5), RIP-REST 5 (light gray bar; n = 6) and RIP-REST (dark gray bar; n = 6) mice. REST mRNA levels are six-fold higher in RIP-REST than in RIP-REST 5 animals. Results are mean ± SD. **P<0.01 versus values of wild type animals. D. REST transgene abundance in islets from P2 RIP-REST 5, RIP-REST and diabetic RIP-REST mice. Upper panel shows representative images of REST protein levels revealed using specific antibodies against REST and AEC staining of peroxydase activity (nuclear black dots). Parallel immunostaining of insulin (red) and the merge shows colocalization of the two signals. Scale bar, 25 μm. Lower panel shows the quantification of the corresponding average pixel intensity per nuclei for each group. *P<0.05 versus the two other groups.
Figure 5
Figure 5. Identification of RE-1-containing genes potentially involved in beta cell survival.
A. Alignment of identified RE-1 sequences in human (hum) or murine (mus) genes with the consensus RE-1. Left alignment identifies members of the insulin-like growth factor transduction pathway: Igfbp7: insulin-like growth factor binding protein 7; IRS: insulin receptor substrate; Akt3: PKB gamma; CTNND2: delta2 catenin; Ctnnb1: beta catenin; MAPK10: JNK3; MAP4K3: MEK kinase kinase 3. Upper right alignment identifies members of the cyclin-related family of mitogenic factors: Cdk5r2: cyclin-dependent kinase 5 regulatory subunit 2; CKS2: CDC28 protein kinase regulatory subunit 2; CNNG1: cyclin G1; Cnnm2: cyclin M2. Lower right alignment identifies Api5: apoptosis inhibitor 5 and Nrg1: neuregulin1. B. Quantitative RT-PCR analysis of mRNA levels from control INS-1E cells (white bars) and INS-1E cells infected with GFP-expressing adenovirus (gray bars) or REST-expressing adenovirus (black bars). Ptprn: protein tyrosine phosphatase, receptor type, N; Irs2: insulin receptor substrate2; Cdk5r2: cyclin-dependent kinase 5 regulatory subunit 2; Nrg1: neuregulin1; Ctnnd2: delta2 catenin; Api5: apoptosis inhibitor 5. Results are mean ± SD of six independent experiments. *P<0.05, **P<0.01, ***P<0.001 versus INS-1E cells transduced with GFP. C. Quantitative RT-PCR analysis of mRNA levels from islets of WT (white bars) (n = 5) and RIP-REST (black bars) (n = 5) mice. Gjd2: Connexin36; Mapk8ip1: Ib1; Cdk5r2: cyclin-dependent kinase 5 regulatory subunit 2; Ptprn: protein tyrosine phosphatase, receptor type, N; Irs2: insulin receptor substrate2; Nrg1: neuregulin1; Ctnnd2: delta2 catenin. Results are mean ± s.e.m. **P<0.01 versus values of wild type animals. D. Left panel, immunoblotting of total proteins from non infected (NI) and infected (Ad-GFP, Ad-REST) INS-1E cells showing decreased protein levels of Cdk5r2 upon REST expression. The right panel shows the corresponding quantifications of REST protein levels in INS-1E cells after infection. Data are mean ± SEM of 4 independent experiments. **P<0.01, ***P<0.001 versus the respective Ad-GFP-infected and NI conditions.
Figure 6
Figure 6. CDK5R2 protects beta cells against cytokines and palmitate.
A. Left panel, immunoblotting of total proteins from INS-1E cells, 72 h after transfection with a negative siRNA (siNeg) or siRNAs against Cdk5r2 (siCdk5r2#1 and siCdk5r2#2). Right panel, quantification of the corresponding Cdk5r2 protein levels. Results are mean ± SEM of three independent experiments. **P<0.01 versus values of siNeg-transduced INS-1E cells. B. Quantification of apoptotic nuclei in non-transfected INS-1E cells (NT) and INS-1E cells transfected with a negative siRNA (siNeg) or with siRNAs against Cdk5r2 (siCdk5r2#1 and siCdk5r2#2), treated 24 h with a mix of cytokines (black bars) or not (white bars). Results are mean ± SEM of six independent experiments. **P<0.01 versus controls. C. Immunoblotting of total proteins from INS-1E cells transfected with a negative siRNA (siNeg) or siRNAs against Cdk5r2 (siCdk5r2#1 and siCdk5r2#2), treated 24 h with a mix of cytokines (Cyt) or not (Ctrl). The cleavage of caspase-9 and −3, induced by cytokines, is higher in siCdk5r2- than in siNeg-treated cells. D. Quantification of apoptotic nuclei in non-transfected INS-1E cells (NT) and INS-1E cells transfected with a negative siRNA (siNeg) or siRNAs against Cdk5r2 (siCdk5r2#1 and siCdk5r2#2), exposed 15 h to control medium (white bars) or palmitate (black bars). Results are mean ± SEM of six independent experiments. **P<0.01 versus controls.

Similar articles

Cited by

References

    1. Butler AE, Janson J, Bonner-Weir S, Ritzel R, Rizza RA, et al. (2003) Beta-cell deficit and increased beta-cell apoptosis in humans with type 2 diabetes. Diabetes 52: 102–110. - PubMed
    1. Kurrer MO, Pakala SV, Hanson HL, Katz JD (1997) Beta cell apoptosis in T cell-mediated autoimmune diabetes. Proc Natl Acad Sci U S A 94: 213–218. - PMC - PubMed
    1. Chang-Chen KJ, Mullur R, Bernal-Mizrachi E (2008) Beta-cell failure as a complication of diabetes. Rev Endocr Metab Disord 9: 329–343. - PMC - PubMed
    1. Hennige AM, Burks DJ, Ozcan U, Kulkarni RN, Ye J, et al. (2003) Upregulation of insulin receptor substrate-2 in pancreatic beta cells prevents diabetes. J Clin Invest 112: 1521–1532. - PMC - PubMed
    1. Withers DJ, Burks DJ, Towery HH, Altamuro SL, Flint CL, et al. (1999) Irs-2 coordinates Igf-1 receptor-mediated beta-cell development and peripheral insulin signalling. Nat Genet 23: 32–40. - PubMed

Publication types

MeSH terms