Differential gene and microRNA expression between etoposide resistant and etoposide sensitive MCF7 breast cancer cell lines
- PMID: 23028896
- PMCID: PMC3445463
- DOI: 10.1371/journal.pone.0045268
Differential gene and microRNA expression between etoposide resistant and etoposide sensitive MCF7 breast cancer cell lines
Abstract
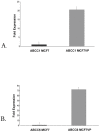
In order to develop targeted strategies for combating drug resistance it is essential to understand it's basic molecular mechanisms. In an exploratory study we have found several possible indicators of etoposide resistance operating in MCF7VP cells, including up-regulation of ABC transporter genes, modulation of miRNA, and alteration in copy numbers of genes.
Conflict of interest statement
Figures


Similar articles
-
Expression analysis of TOP2A, MSH2 and MLH1 genes in MCF7 cells at different levels of etoposide resistance.Biomed Pharmacother. 2012 Feb;66(1):29-35. doi: 10.1016/j.biopha.2011.09.002. Epub 2011 Dec 28. Biomed Pharmacother. 2012. PMID: 22285073
-
The phytoestrogen genistein enhances multidrug resistance in breast cancer cell lines by translational regulation of ABC transporters.Cancer Lett. 2016 Jun 28;376(1):165-72. doi: 10.1016/j.canlet.2016.03.040. Epub 2016 Mar 24. Cancer Lett. 2016. PMID: 27033456
-
Involvement of miR-326 in chemotherapy resistance of breast cancer through modulating expression of multidrug resistance-associated protein 1.Biochem Pharmacol. 2010 Mar 15;79(6):817-24. doi: 10.1016/j.bcp.2009.10.017. Epub 2009 Oct 31. Biochem Pharmacol. 2010. PMID: 19883630
-
Multidrug resistance mediated by the breast cancer resistance protein BCRP (ABCG2).Oncogene. 2003 Oct 20;22(47):7340-58. doi: 10.1038/sj.onc.1206938. Oncogene. 2003. PMID: 14576842 Review.
-
Role of MRP1 in multidrug resistance in acute myeloid leukemia.Leukemia. 1999 Apr;13(4):578-84. doi: 10.1038/sj.leu.2401361. Leukemia. 1999. PMID: 10214864 Review.
Cited by
-
MiR-23a-mediated inhibition of topoisomerase 1 expression potentiates cell response to etoposide in human hepatocellular carcinoma.Mol Cancer. 2013 Oct 8;12(1):119. doi: 10.1186/1476-4598-12-119. Mol Cancer. 2013. PMID: 24103454 Free PMC article.
-
miR-137 regulates the constitutive androstane receptor and modulates doxorubicin sensitivity in parental and doxorubicin-resistant neuroblastoma cells.Oncogene. 2014 Jul 10;33(28):3717-29. doi: 10.1038/onc.2013.330. Epub 2013 Aug 12. Oncogene. 2014. PMID: 23934188 Free PMC article.
-
Identification of two novel heterodimeric ABC transporters in melanoma: ABCB5β/B6 and ABCB5β/B9.J Biol Chem. 2024 Feb;300(2):105594. doi: 10.1016/j.jbc.2023.105594. Epub 2023 Dec 23. J Biol Chem. 2024. PMID: 38145744 Free PMC article.
-
miR-137 mediates the functional link between c-Myc and EZH2 that regulates cisplatin resistance in ovarian cancer.Oncogene. 2019 Jan;38(4):564-580. doi: 10.1038/s41388-018-0459-x. Epub 2018 Aug 30. Oncogene. 2019. PMID: 30166592 Free PMC article.
-
Current state of phenolic and terpenoidal dietary factors and natural products as non-coding RNA/microRNA modulators for improved cancer therapy and prevention.Noncoding RNA Res. 2016 Jul 27;1(1):12-34. doi: 10.1016/j.ncrna.2016.07.001. eCollection 2016 Oct. Noncoding RNA Res. 2016. PMID: 30159408 Free PMC article. Review.
References
-
- Gonzalez-Angulo AM, Morales-Vasquez F, Hortobagyi GN (2007) Overview of resistance to systemic therapy in patients with breast cancer. Adv Exp Med Biol 608: 1–22. - PubMed
-
- Henwood JM, Brogden RN (1990) Etoposide. A review of its pharmacodynamic and pharmacokinetic properties, and therapeutic potential in combination chemotherapy of cancer. Drugs 39(3): 438–490. - PubMed
-
- Atienza DM, Vogel CL, Trock B, Swain SM (1995) Phase II study of oral etoposide for patients with advanced breast cancer. Cancer 76(12): 2485–2490. - PubMed
-
- Icli F, Akbulut H, Uner A, Yalcin B, Baltali E, et al. (2005) Cisplatin plus oral etoposide (EoP) combination is more effective than paclitaxel in patients with advanced breast cancer pretreated with anthracyclines: a randomised phase III trial of Turkish Oncology Group. Br J Cancer 92(4): 639–644. - PMC - PubMed
Publication types
MeSH terms
Substances
Grants and funding
LinkOut - more resources
Full Text Sources
Medical
Molecular Biology Databases

