. 2012:3:1078.
doi: 10.1038/ncomms2090.

The miRNA-212/132 family regulates both cardiac hypertrophy and cardiomyocyte autophagy

Affiliations
Free PMC article

The miRNA-212/132 family regulates both cardiac hypertrophy and cardiomyocyte autophagy

Ahmet Ucar et al. Nat Commun. 2012.
Free PMC article

Abstract

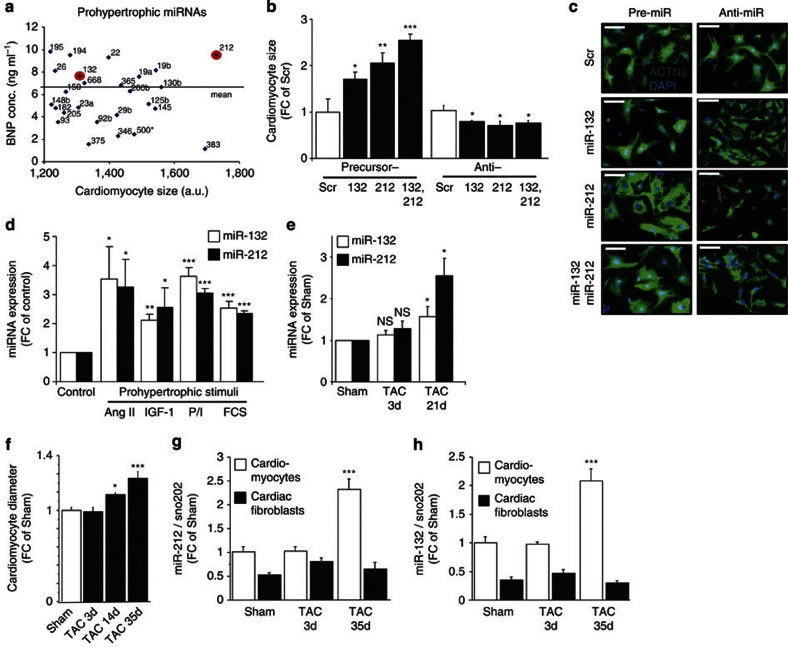
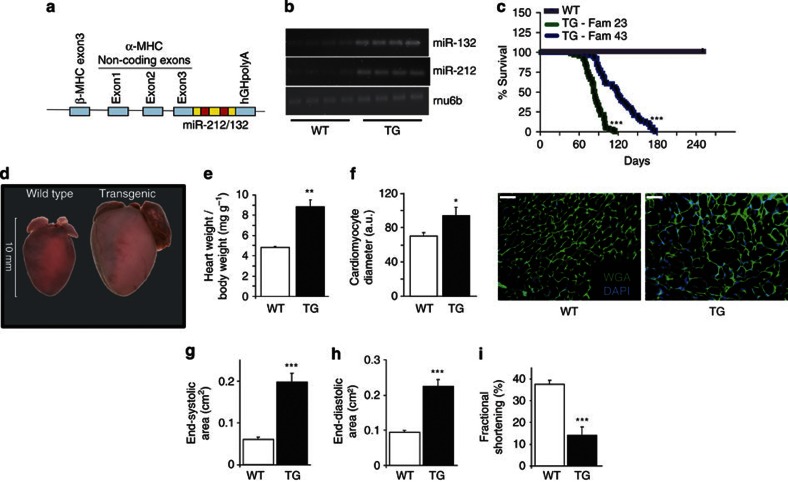
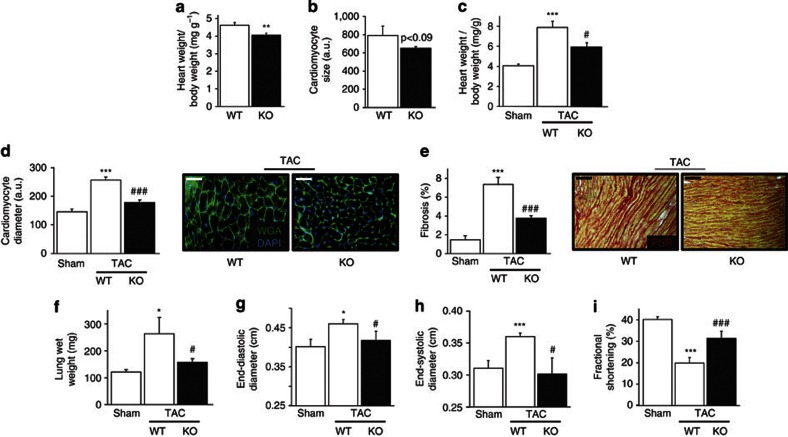
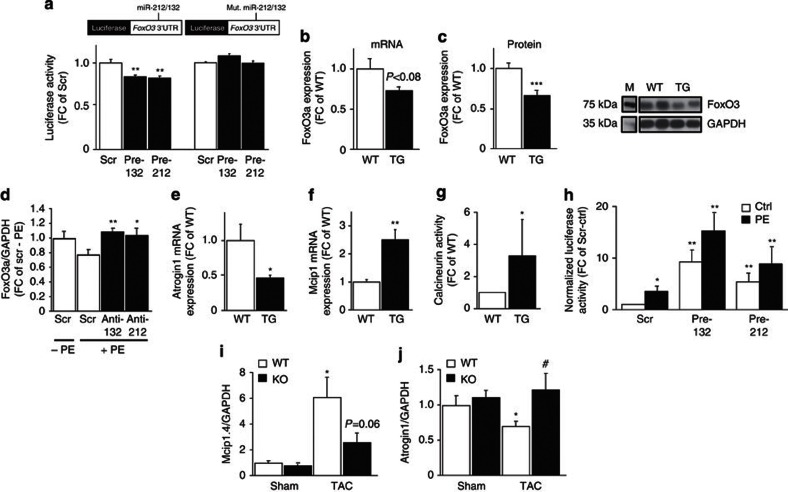
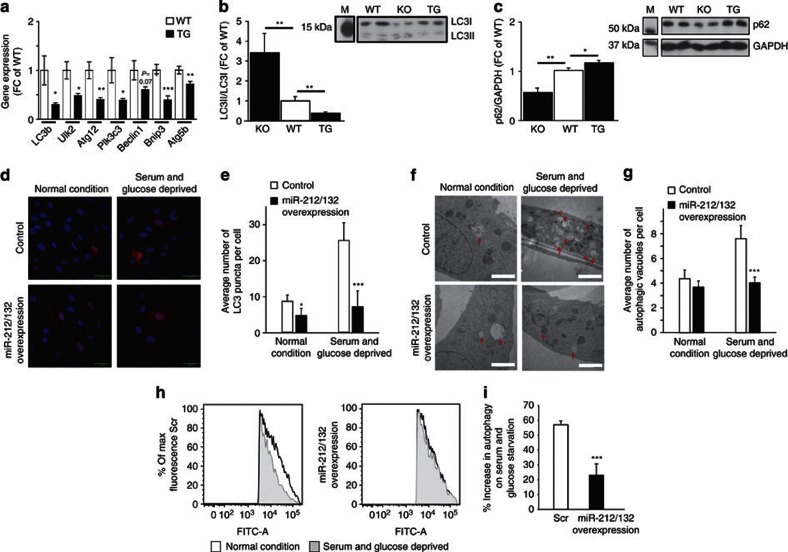
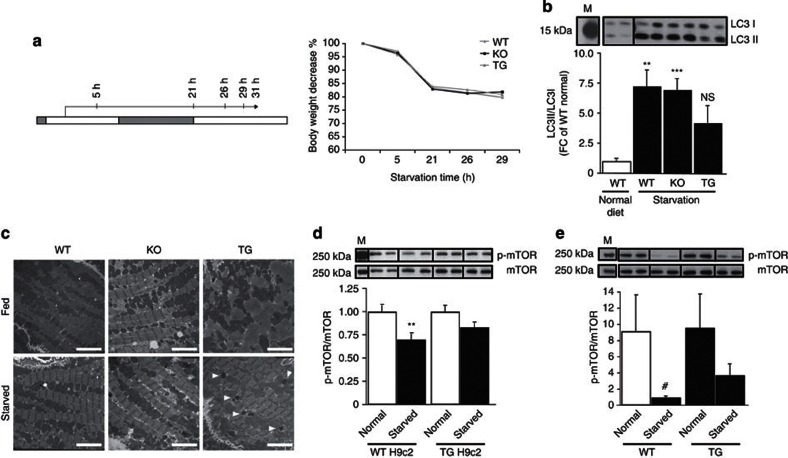
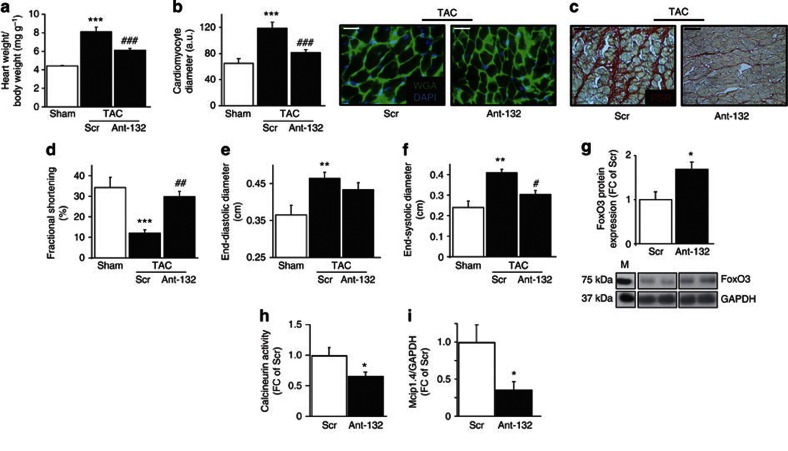
Pathological growth of cardiomyocytes (hypertrophy) is a major determinant for the development of heart failure, one of the leading medical causes of mortality worldwide. Here we show that the microRNA (miRNA)-212/132 family regulates cardiac hypertrophy and autophagy in cardiomyocytes. Hypertrophic stimuli upregulate cardiomyocyte expression of miR-212 and miR-132, which are both necessary and sufficient to drive the hypertrophic growth of cardiomyocytes. MiR-212/132 null mice are protected from pressure-overload-induced heart failure, whereas cardiomyocyte-specific overexpression of the miR-212/132 family leads to pathological cardiac hypertrophy, heart failure and death in mice. Both miR-212 and miR-132 directly target the anti-hypertrophic and pro-autophagic FoxO3 transcription factor and overexpression of these miRNAs leads to hyperactivation of pro-hypertrophic calcineurin/NFAT signalling and an impaired autophagic response upon starvation. Pharmacological inhibition of miR-132 by antagomir injection rescues cardiac hypertrophy and heart failure in mice, offering a possible therapeutic approach for cardiac failure.


Conflict of interest statement

A.U., S.K.G., K.C. and T.T. are co-inventors on a patent entitled 'Inhibition of microRNA-212/132 as a therapeutical approach for the treatment and prevention of hypertrophy and autophagy associated heart diseases.' The remaining authors declare no competing financial interests.

Figures

Figure 1
Figure 1. MiR-212 and miR-132 are pro-hypertrophic miRNAs induced by hypertrophic stimuli.
(a) Overexpression of miRNA precursors from a library identified miRNAs enhancing cardiomyocyte growth and brain natriuretic peptide (BNP) secretion. The miRNA family, miR-212/132, is highlighted by red circles. (b,c) Effects of miR-212 and miR-132 precursors and inhibitors (anti) on cardiomyocyte cell size as compared with the effects of scrambled (Scr) controls (n=5–13). Representative images used for quantification of cardiomyocyte cell size are shown in c. (d) Effects of various pro-hypertrophic stimuli on miR-212 and miR-132 expression in neonatal cardiomyocytes (n=6–10). (e) miR-212 and miR-132 expression levels during pressure-induced left ventricular hypertrophy 3 and 21 days after transaortic constriction (TAC) surgery of mice (n=4). (f) Cardiomyocyte diameters after Sham operation or 3, 14 and 35 days after TAC (n=4 per group). (g,h) miR-212 and miR-132 expression (normalized to sno-202 levels) in fractionated cardiomyocytes and cardiac fibroblasts derived from adult mice after 3 and 35 days of TAC. All values represent mean±s.e.m. *P<0.05; **P<0.01; ***P<0.005. Scale bar in c represents 50 μm. ACTN2, α-cardiac actinin; Ang II, angiotensin-2; a.u., arbitrary unit; d, day; DAPI, 4′,6-diamidino-2-phenylindole; FC, fold change; NS, no significant difference; P/I, phenylephrine/isoprenaline.
Figure 2
Figure 2. Overexpression of miR-212 and miR-132 in cardiomyocytes causes hypertrophy and heart failure.
(a) Overexpression construct of miR-212/132 under the control of the α-MHC promoter. (b) Expression levels of miR-212 and miR-132 in heart samples of individual wild-type (WT) and miR-212/132 transgenic (TG) mice as assayed by RT–PCR analysis against the mature forms of corresponding microRNAs. Rnu6b was used as housekeeping control. (c) Survival rate of two different miR-212/132 TG mouse families (TG-Fam23, TG-Fam43) versus WT controls was analysed by Kaplan–Meier survival assay (n=87, 65 and 53 for WT, TG-Fam23 and TG-Fam43, respectively). (d) Morphology of explanted hearts from TG and WT mice at 10 weeks after birth. Scale bar, 1 cm. (e,f) Heart-to-body-weight ratios (e) and cardiomyocyte diameter (f) in 8-week-old α-MHC-miR-212/132 transgenic mice compared with their wild-type littermates (n=5–7). Scale bar, 50 μm. (gi) Echocardiographic analysis of cardiac dimensions and function for α-MHC-miR-212/132 TG mice and WT controls (n=16–18) (g) end-systolic area, (h) end-diastolic area, (i) fractional shortening. All values in ei represent mean±s.e.m. *P<0.05; **P<0.01; ***P<0.005. DAPI, 4′,6-diamidino-2-phenylindole; WGA, wheat germ agglutinin (membrane stain).
Figure 3
Figure 3. MiR-212/132 null mice are protected from transaortic constriction (TAC)-induced hypertrophy and heart failure.
(a) Heart-to-body-weight ratios for 12-week-old miR-212/132 null (KO) and wild-type (WT) mice (n=5–6). (b) Cardiomyocyte cell size of neonatal miR-212/132 null and WT mice (n=5–6 isolations). (cf) Heart-to-body-weight ratios (c), cardiomyocyte diameter (d), cardiac fibrosis (e) and lung wet weight (f) in Sham-operated WT mice and miR-212/132 null and WT mice 3 weeks after TAC surgery (n=4–7). Scale bar, 50 μm. (gi) Echocardiographic analysis of cardiac dimensions and function in Sham-operated WT mice and miR-212/132 null and WT mice 3 weeks after TAC (n=4–11). (g) End-diastolic area, (h) end-systolic area and (i) fractional shortening. All values represent mean±s.e.m. *P<0.05; **P<0.01; ***P<0.005; #P<0.05 compared with WT TAC; ###P<0.005 compared with WT TAC; PSR, picrosirius red (collagen stain). DAPI, 4′,6-diamidino-2-phenylindole; WGA, wheat germ agglutinin.
Figure 4
Figure 4. MiR-212 and miR-132 regulate calcineurin signalling via targeting FoxO3 expression.
(a) Luciferase activity levels upon cotransfection of a luciferase construct containing wild-type (WT) or mutated (Mut.) 3′UTR of FoxO3 with scrambled (Scr) control (Ctrl), pre-miR-132 or pre-miR-212 (n=9). (b,c) Expression levels of FoxO3 on mRNA (b) and protein levels (c) in hearts of WT and α-MHC-miR-212/-132 transgenic (TG) mice. M: Size marker (n=9–13). (d) FoxO3 mRNA levels in neonatal rat cardiomyocytes transfected with Scr Ctrl, anti-miR-212 and anti-miR-132 after phenylephrine (PE, 10 μM) treatment (n=6–9; P-values against Scr+PE). (eg) Expression levels of atrogin-1 (e) and Mcip1 (f) and calcineurin phosphatase activity levels (g) in hearts of WT and α-MHC-miR-212/132 TG mice (n=5–9). (h) Luciferase activity levels showing the NFAT transcriptional activity in cardiomyocytes transfected with Scr Ctrl, pre-miR-132 or pre-miR-212 (n=5). (i,j) Mcip1.4 (i) and atrogin-1 (j) mRNA levels in WT and miR-212/132 null (KO) mice 3 weeks after transaortic constriction (TAC) or Sham operation (n=5–7 per group). All values represent mean±s.e.m. *P<0.05; **P<0.01; ***P<0.005. #P<0.05 compared with WT TAC. FC, fold change.
Figure 5
Figure 5. MiR-212 and miR-132 are anti-autophagic factors in cardiomyocytes.
(a) mRNA expression levels of autophagic marker genes in hearts of wild-type (WT) and α-MHC-miR-212/132 transgenic (TG) mice (n=9–10). (b,c) Ratio of LC3II to LC3I (b) and p62 protein levels (c) in WT, miR-212/132 null (KO) and α-MHC miR-212/132 TG mice. M: Size marker (n=4–12). (d,e) Representative images (d) and quantification (e) of LC3:mCherry puncta (in red) in control and miR-212/132-overexpressing TG H9c2 cells under normal and serum/glucose-deprivation conditions (n=30). Nuclei are stained in blue with Hoechst33342. (f,g) Representative electron microscopy images (f) and quantification (g) of autophagic vacuoles in control and miR-212/132-overexpressing TG H9c2 cells under normal and serum/glucose-deprivation conditions (n=20). (h,i) Representative FACS plots (h) and quantification (i) of percent increase of autophagic flux in control and miR-212/132-overexpressing TG H9c2 cells under normal and serum/glucose-deprivation conditions (n=3–4 experiments). All values represent mean±s.e.m. *P<0.05; **P<0.01; ***P<0.005. Scale bars, 50 μm in d and 2 μm in f. FC, fold change.
Figure 6
Figure 6. MiR-212 and miR-132 inhibit starvation-induced autophagy in vivo.
(a) Schematic representation of starvation experiment in mice. The white and grey parts on the time line represent the day and night phases, respectively. The arrow shows the start and duration of the starvation and the indicated time points of starvation are when animals are scored for body conditioning index. (b) LC3II to LC3I ratios in wild-type (WT) mice fed with normal diet and WT, miR-212/132−/− null and α-MHC miR-212/132 transgenic (TG) mice under starvation for 31 h (n=4). (c) Electron micrographs from ultrathin sections of resin-embedded heart biopsies of fed and starved WT, miR-212/132 null (KO) and cardiomyocyte-specific miR-212/132-overexpressing (TG) mice. White spots around the mitochondria (dark grey structures) are autophagic vacuoles. The electron-dense black spots shown with white arrows are autophagosomes. Scale bars, 4 μm. (d) p-mTOR/mTOR ratios in WT and miR-212/132 TG H9c2 cells 24 h after normal and starvation (serum/glucose-deprived) conditions (n=6). (e) p-mTOR/mTOR ratios in hearts of WT and α-MHC miR-212/132 TG mice fed with normal diet or 31 h after starvation (n=4). M, size marker. All values represent mean±s.e.m. **P<0.01; ***P<0.005; #P=0.11.
Figure 7
Figure 7. Anti-miR-132 therapy prevents pressure-overload-induced heart failure.
(ac) Heart-to-body-weight ratios (a), cardiomyocyte diameters (b) and cardiac fibrosis (c) in Sham-operated mice and mice treated with intravenous injection of either scrambled control (Scr) or miR-132 inhibitors (Ant-132) after TAC. These mice were analysed 3 weeks after TAC (n=4–11). PSR, picrosirius red staining. (df) Echocardiographic analysis of cardiac dimensions and function in Sham-operated mice and mice treated with intravenous injection of either control (Scr) or miR-132 inhibitors (Ant-132) after TAC. These mice were analysed 3 weeks after TAC for (d) fractional shortening, (e) end-diastolic area and (f) end-systolic area (n=4–9). (gi) Cardiac FoxO3 protein levels (g), calcineurin activity (h) and Mcip1.4 mRNA levels (i) in mice treated with intravenous injection of either control (Scr) or miR-132 inhibitors (Ant-132) 3 weeks after TAC and treatment (n=4–8). M: size marker. All values represent mean±s.e.m. *P<0.05; **P<0.01; ***P<0.005; #P<0.05 against TAC-control; ##P<0.01 against TAC-control; ###P<0.005 against TAC-control. Scale bars, 50 μm. DAPI, 4′,6-diamidino-2-phenylindole; FC, fold change; WGA, wheat germ agglutinin.

Similar articles

Cited by

References

    1. Hill J. A. & Olson E. N. Cardiac plasticity. N. Engl. J. Med. 358, 1370–1380 (2008). - PubMed
    1. Barry S. P. & Townsend P. A. What causes a broken heart-molecular insights into heart failure. Int. Rev. Cell Mol. Biol. 284, 113–179 (2010). - PubMed
    1. Ronnebaum S. M. & Patterson C. The FoxO family in cardiac function and dysfunction. Annu. Rev. Physiol. 72, 81–94 (2010). - PMC - PubMed
    1. Ni Y. G. et al.. Foxo transcription factors blunt cardiac hypertrophy by inhibiting calcineurin signaling. Circulation 114, 1159–1168 (2006). - PMC - PubMed
    1. Glas D. J. PI3 kinase regulation of skeletal muscle hypertrophy and atrophy. Curr. Top. Microbiol. Immunol. 346, 267–278 (2010). - PubMed

Publication types