

A peripheral blood diagnostic test for acute rejection in renal transplantation
- PMID: 23009139
- PMCID: PMC4148014
- DOI: 10.1111/j.1600-6143.2012.04253.x
A peripheral blood diagnostic test for acute rejection in renal transplantation
Abstract
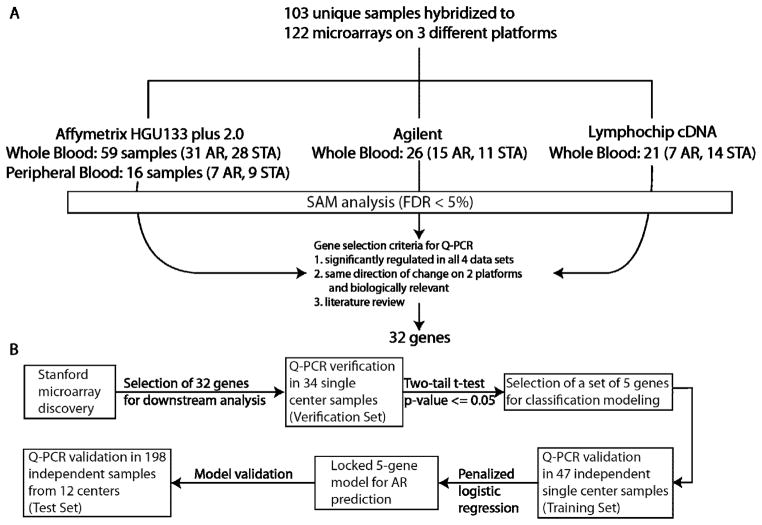
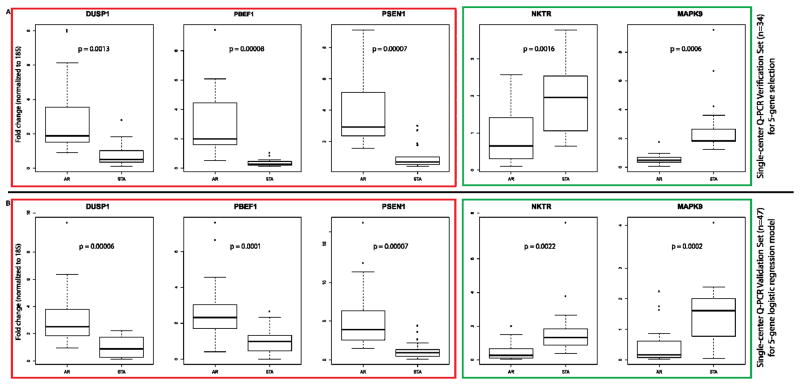
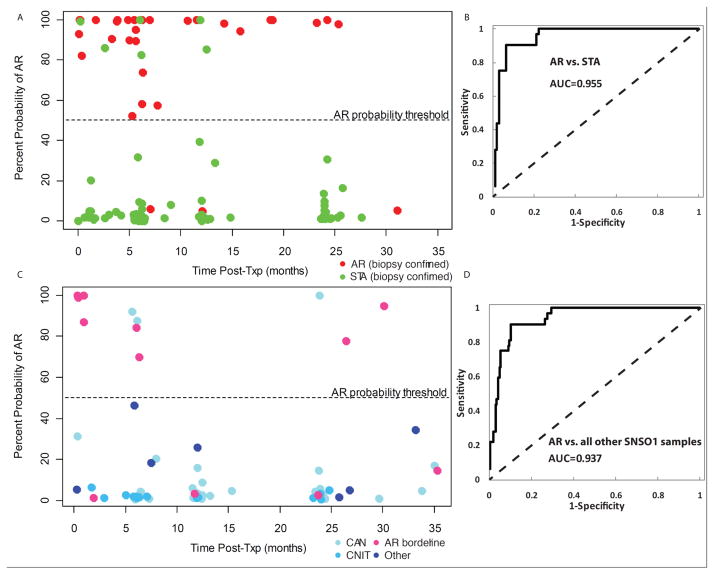
Monitoring of renal graft status through peripheral blood (PB) rather than invasive biopsy is important as it will lessen the risk of infection and other stresses, while reducing the costs of rejection diagnosis. Blood gene biomarker panels were discovered by microarrays at a single center and subsequently validated and cross-validated by QPCR in the NIH SNSO1 randomized study from 12 US pediatric transplant programs. A total of 367 unique human PB samples, each paired with a graft biopsy for centralized, blinded phenotype classification, were analyzed (115 acute rejection (AR), 180 stable and 72 other causes of graft injury). Of the differentially expressed genes by microarray, Q-PCR analysis of a five gene-set (DUSP1, PBEF1, PSEN1, MAPK9 and NKTR) classified AR with high accuracy. A logistic regression model was built on independent training-set (n = 47) and validated on independent test-set (n = 198)samples, discriminating AR from STA with 91% sensitivity and 94% specificity and AR from all other non-AR phenotypes with 91% sensitivity and 90% specificity. The 5-gene set can diagnose AR potentially avoiding the need for invasive renal biopsy. These data support the conduct of a prospective study to validate the clinical predictive utility of this diagnostic tool.
© Copyright 2012 The American Society of Transplantation and the American Society of Transplant Surgeons.
Figures
Comment in
-
Is the time ripe for genomic diagnosis and prediction of rejection?Am J Transplant. 2012 Oct;12(10):2573-4. doi: 10.1111/j.1600-6143.2012.04250.x. Am J Transplant. 2012. PMID: 23009138 Free PMC article. No abstract available.
-
Transplantation: Biomarkers in peripheral blood detect acute rejection.Nat Rev Nephrol. 2012 Dec;8(12):681. doi: 10.1038/nrneph.2012.227. Epub 2012 Oct 16. Nat Rev Nephrol. 2012. PMID: 23070573 No abstract available.
Similar articles
-
Validation study of peripheral blood diagnostic test for acute rejection in kidney transplantation.Transplantation. 2014 Oct 15;98(7):760-5. doi: 10.1097/TP.0000000000000138. Transplantation. 2014. PMID: 25208320
-
The kSORT assay to detect renal transplant patients at high risk for acute rejection: results of the multicenter AART study.PLoS Med. 2014 Nov 11;11(11):e1001759. doi: 10.1371/journal.pmed.1001759. eCollection 2014 Nov. PLoS Med. 2014. PMID: 25386950 Free PMC article.
-
Identification of common blood gene signatures for the diagnosis of renal and cardiac acute allograft rejection.PLoS One. 2013 Dec 16;8(12):e82153. doi: 10.1371/journal.pone.0082153. eCollection 2013. PLoS One. 2013. PMID: 24358149 Free PMC article.
-
Urinary Cell mRNA Profiles Predictive of Human Kidney Allograft Status.Clin J Am Soc Nephrol. 2021 Oct;16(10):1565-1577. doi: 10.2215/CJN.14010820. Epub 2021 Apr 27. Clin J Am Soc Nephrol. 2021. PMID: 33906907 Free PMC article. Review.
-
Non-invasive biomarkers of acute rejection in pediatric kidney transplantation: New targets and strategies.Life Sci. 2024 Jul 1;348:122698. doi: 10.1016/j.lfs.2024.122698. Epub 2024 May 6. Life Sci. 2024. PMID: 38710278 Review.
Cited by
-
Is the time ripe for genomic diagnosis and prediction of rejection?Am J Transplant. 2012 Oct;12(10):2573-4. doi: 10.1111/j.1600-6143.2012.04250.x. Am J Transplant. 2012. PMID: 23009138 Free PMC article. No abstract available.
-
Biomarkers for kidney transplant rejection.Nat Rev Nephrol. 2014 Apr;10(4):215-25. doi: 10.1038/nrneph.2013.281. Epub 2014 Jan 21. Nat Rev Nephrol. 2014. PMID: 24445740 Review.
-
Development and clinical validity of a novel blood-based molecular biomarker for subclinical acute rejection following kidney transplant.Am J Transplant. 2019 Jan;19(1):98-109. doi: 10.1111/ajt.15011. Epub 2018 Aug 31. Am J Transplant. 2019. PMID: 29985559 Free PMC article.
-
Molecular assessment of disease states in kidney transplant biopsy samples.Nat Rev Nephrol. 2016 Sep;12(9):534-48. doi: 10.1038/nrneph.2016.85. Epub 2016 Jun 27. Nat Rev Nephrol. 2016. PMID: 27345248 Review.
-
Both absolute and relative quantification of urinary mRNA are useful for non-invasive diagnosis of acute kidney allograft rejection.PLoS One. 2017 Jun 27;12(6):e0180045. doi: 10.1371/journal.pone.0180045. eCollection 2017. PLoS One. 2017. PMID: 28654700 Free PMC article.
References
-
- Racusen LC. The Banff schema and differential diagnosis of allograft dysfunction. Transplant Proc. 2004;36(3):753–4. - PubMed
-
- Thierry A, Thervet E, Vuiblet V, Goujon JM, Machet MC, Noel LH, et al. Long-term Impact of Subclinical Inflammation Diagnosed by Protocol Biopsy One Year After Renal Transplantation. Am J Transplant. 2011 Epub 2011/09/03. - PubMed
-
- Sarwal M, Chua MS, Kambham N, Hsieh SC, Satterwhite T, Masek M, et al. Molecular heterogeneity in acute renal allograft rejection identified by DNA microarray profiling. N Engl J Med. 2003;349(2):125–38. - PubMed
-
- Park W, Griffin M, Grande JP, Cosio F, Stegall MD. Molecular evidence of injury and inflammation in normal and fibrotic renal allografts one year posttransplant. Transplantation. 2007;83(11):1466–76. - PubMed
-
- Hoffmann SC, Hale DA, Kleiner DE, Mannon RB, Kampen RL, Jacobson LM, et al. Functionally significant renal allograft rejection is defined by transcriptional criteria. Am J Transplant. 2005;5(3):573–81. Epub 2005/02/15. - PubMed
Publication types
MeSH terms
Grants and funding
LinkOut - more resources
Full Text Sources
Other Literature Sources
Medical
Molecular Biology Databases
Research Materials
Miscellaneous
