. 2012 Nov;13(11):1092-100.
doi: 10.1038/ni.2418. Epub 2012 Sep 23.

The cell-cycle regulator c-Myc is essential for the formation and maintenance of germinal centers

Affiliations

The cell-cycle regulator c-Myc is essential for the formation and maintenance of germinal centers

Dinis Pedro Calado et al. Nat Immunol. 2012 Nov.

Abstract

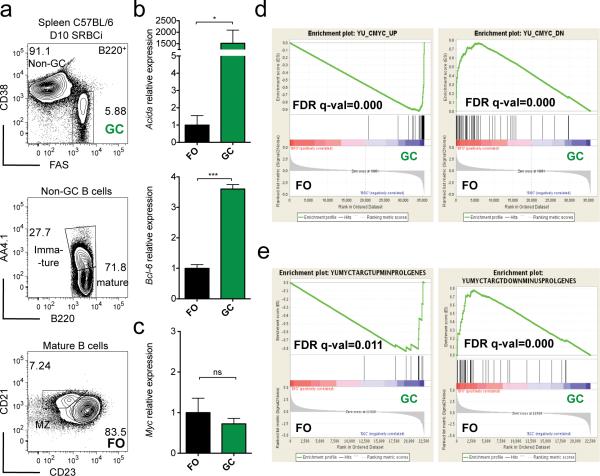
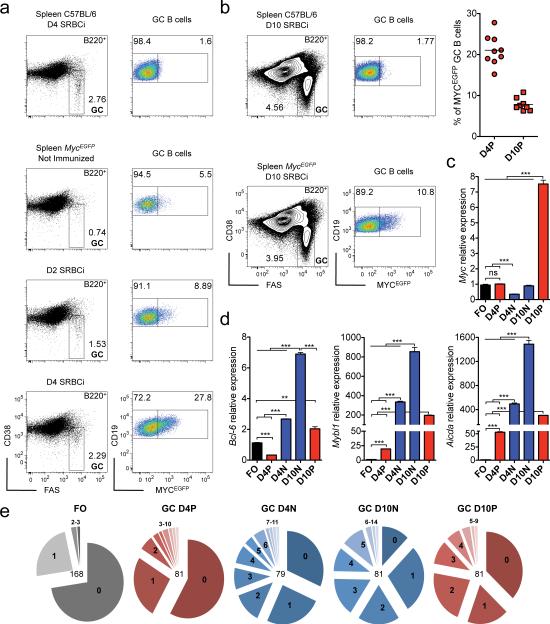
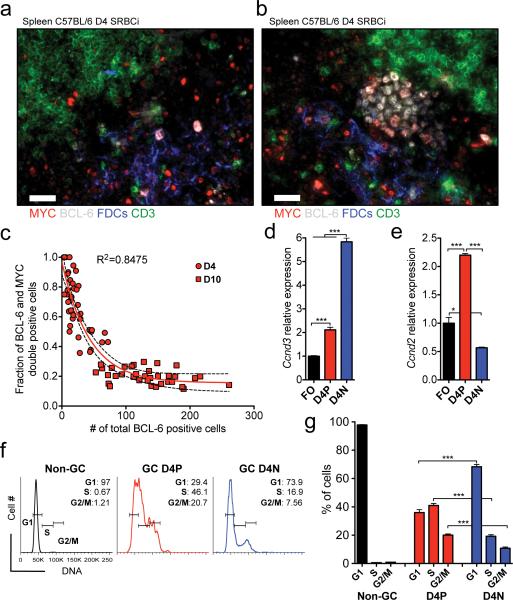
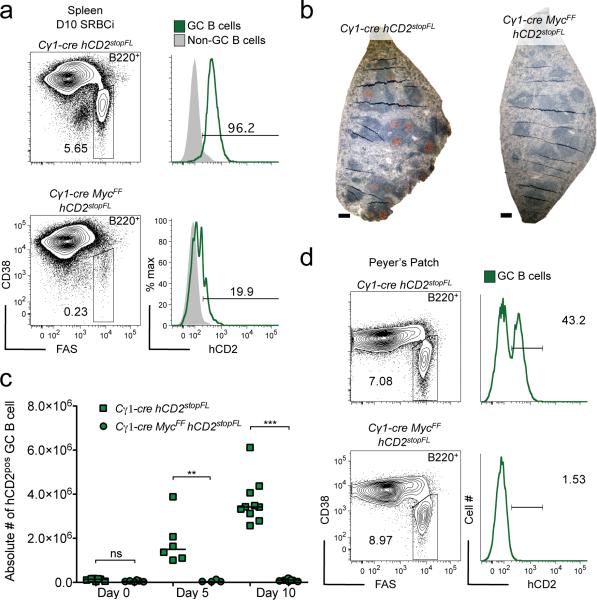
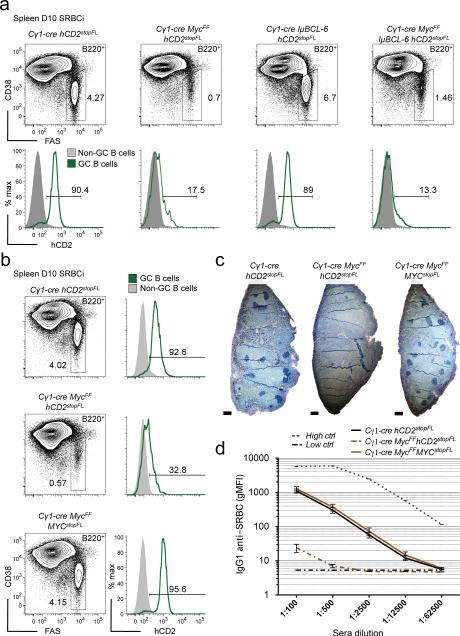
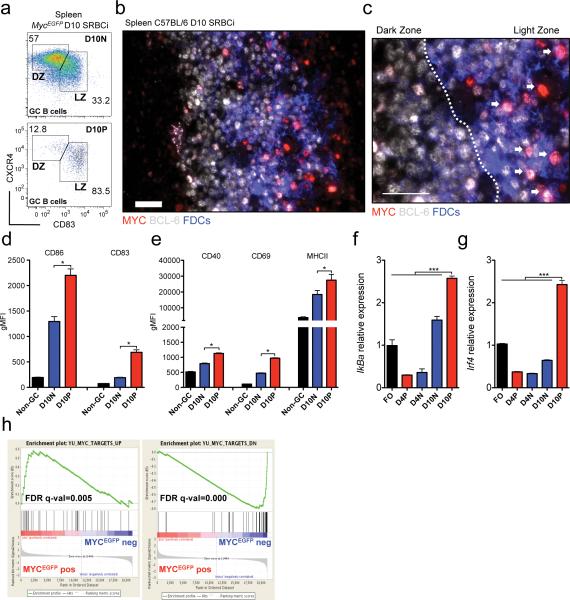
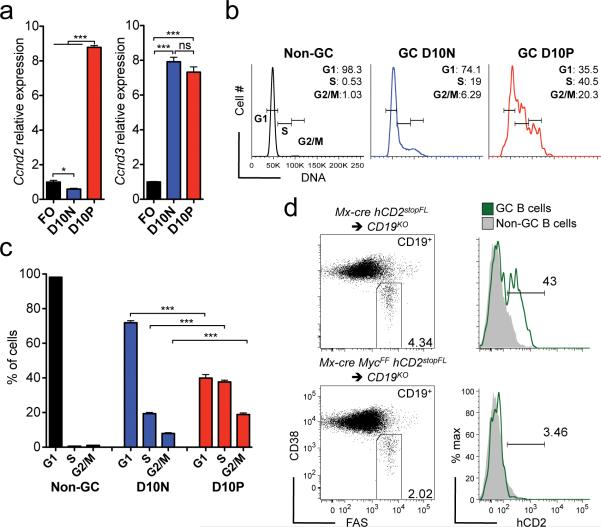
Germinal centers (GCs) are sites of intense B cell proliferation and are central for T cell-dependent antibody responses. However, the role of c-Myc, a key cell-cycle regulator, in this process has been questioned. Here we identified c-Myc(+) B cell subpopulations in immature and mature GCs and found, by genetic ablation of Myc, that they had indispensable roles in the formation and maintenance of GCs. The identification of these functionally critical cellular subsets has implications for human B cell lymphomagenesis, which originates mostly from GC B cells and frequently involves MYC chromosomal translocations. As these translocations are generally dependent on transcription of the recombining partner loci, the c-Myc(+) GC subpopulations may be at a particularly high risk for malignant transformation.


Figures

Figure 1
Figure 1. MYC target genes are enriched in GC B cells
(a) Flow cytometry analysis and gating strategy for flow sorting of splenic GC B cells (B220posCD38lowCD95high) and FO B cells (B220posCD38highAA4.1negCD21posCD23high) of 10 day SRBC immunized (D10 SRBCi) C57BL/6 wild-type mice. (b) Real-time PCR analysis of Bcl-6 and Aicda mRNA of flow sorted GC (green) and FO (black) B cells. Data are presented relative to Hprt and normalized to FO B cells, (mean and s.e.m. of triplicates). (c) Real-time PCR analysis of Myc mRNA as in (b). Data are presented as in (b). (d) GSEA of FO and GC B cell gene expression profiles for the MYC up-regulated (YU_MYC_TARGETS_UP, left panel) and downregulated (YU_MYC_TARGETS_DOWN, right panel) gene sets. (e) GSEA of FO and GC B cell gene expression profiles for MYC up-regulated (left panel) and downregulated (right panel) gene sets, as in (d) upon removal of genes, from those gene sets, whose GO-terms contain, ‘proliferation’, ‘cell cycle’ or ‘growth’, MINUSPROLGENES. FO and GC B cell gene expression profiles (GEO:GSE15907, ImmGen). See Methods for GSEA analysis details. Data are representative of 3 independent experiments (a-c). ns, not statistically significant. * p≤0.05, ** p≤0.01, *** p≤0.001.
Figure 2
Figure 2. A fraction of both newly formed and mature GC B cells is positive for MYC
(a) Flow cytometry analysis of splenic GC B cells for MYCEGFP expression of 4 day SRBC immunized (D4 SRBCi) C57BL/6 wild-type mice and of MycEGFP mice either not-immunized, 2 day (D2 SRBCi) and 4 day (D4 SRBCi) SRBC immunized. (b) Flow cytometry as in (a) of 10 day SRBC immunized (D10 SRBCi) C57BL/6 wild-type and MycEGFP mice. Right panel, graphical representation of the frequency of MYCEGFP positive cells within GC B cells of D4 SRBCi and D10 SRBCi MycEGFP mice (c) Real-time PCR analysis of Myc mRNA of flow sorted FO and of day 4 MYCEGFP positive (D4P) and negative (D4N) GC Bcells, and day 10 MYCEGFP positive (D10P) and negative (D10N) GC B cells. Data are presented relative to Hprt and normalized to FO B cells, (mean and s.e.m. of triplicates). (d) Real-time PCR analysis of Bcl6, Mybl1 and Aicda mRNA as in (c). Data are presented as in (c). (e) Igh somatic mutation of FO B cells and D4P, D4N, D10N, D10P GC B cells. Numbers in the center of the pie-chart represent sequences analyzed, and in each pie-chart section the number of mutations. Data are representative of at least 3 (a,b), 5 independent experiments (c,d), and of 3 mice (f). ns, not statistically significant. * p≤0.05, ** p≤0.01, *** p≤0.001.
Figure 3
Figure 3. Early GC B cells express both MYC and BCL-6 and are hyperproliferative
(a) Representative image of histological immunofluorescence analysis of spleen of 4 day SRBC immunized (D4 SRBCi) C57BL/6 wild-type mice. T cells (CD3, green), FDCs (CD35, Blue), BCL-6 (white), MYC (red), cut-off of ≤20 BCL-6 positive cells per FDC area. (b) Representative image as in (a), cut-off of >20 BCL-6 positive cells per FDC area (c) Graphical representation of the fraction of BCL-6 and MYC double positive cells as function of BCL-6 positive cell count per FDC area. Data of GCs of D4 SRBCi (D4) and D10 SRBCi (D10) C57BL/6 wild-type mice. Each red symbol represents the analysis of one FDC area. Red line represents non-linear regression curve fit assuming an one-phase decay. Dashed line represents 95% confidence interval. (d) Real-time PCR analysis of Ccnd3 mRNA, of flow sorted FO and of day 4 MYCEGFP positive (D4P) and negative (D4N) GC B cells. Data are presented relative to Hprt and normalized to FO B cells, (mean and s.e.m. of triplicates). (e) Real-time PCR analysis of Ccnd2 mRNA, as in (d). Data are presented as in (d). (f) Flow cytometry analysis of the DNA content of non-GC B cells, and of D4P and D4N GC B cells. (g) Graphical representation of the data presented in (f), (mean and s.e.m.). Scale bar 25μm (a, b). Data are representative of at least 3 (a-c,f,g) and 5 (d,e) independent experiments. ns, not statistically significant. * p≤0.05, ** p≤0.01, *** p≤0.001.
Figure 4
Figure 4. MYC is essential for GC formation
(a) Flow cytometry analysis of splenic GC B cells of 10 day SRBC immunized (D10 SRBCi) mice of the indicated genotypes, right panel analysis of reporter (hCD2) positive GC B cells. (b) Representative images of histological immunohistochemical analysis of spleen of D10 SRBCi mice of the indicated genotypes. PNA (brown) and hematoxylin as counterstain. (c) Graphical representation of flow cytometry data of splenic hCD2 positive GC B cells of mice of the indicated genotypes, either not immunized or 5 and 10 days after SRBC immunization. (d) Flow cytometry analysis of peyer's patch GC B cells of mice of the indicated genotypes, right panel analysis of hCD2 positive GC B cells. Scale bar 25μm (b). Data are representative of at least 3 independent experiments (a-d). ns, not statistically significant. * p≤0.05, ** p≤0.01, *** p≤0.001.
Figure 5
Figure 5. Enforced Bcl6 expression fails to rescue GC formation upon Myc ablation
(a) Flow cytometry analysis of splenic GC B cells of 10 day SRBC immunized (D10 SRBCi) mice of the indicated genotypes, lower panel, analysis of reporter (hCD2) positive GC B cells. (b) Flow cytometry analysis as in (a), of mice of the indicated genotypes, right panel as in (a). (c) Representative images of histological immunohistochemical analysis of spleen of D10 SRBCi mice of the indicated genotypes. BCL-6 (dark blue). (d) Graphical representation of flow cytometry measured anti-SRBC specific IgG1 serum antibodies at D10 SRBCi, (mean and s.e.m.), Low ctrl, unimmunized mice, High ctrl, serum from mice hyperimmunized. Scale bar 25μm (c). Data are representative of at least 3 independent experiments (a-c) and of 4 mice (d).
Figure 6
Figure 6. MYC positive GC B cells in mature GCs localize to the light zone and display an activated phenotype
(a) Flow cytometry analysis of splenic MYCEGFP negative (D10N) and positive (D10P) GC B cells of 10 day SRBC immunized (D10 SRBCi) MycEGFP mice. DZ, dark zone; LZ, light zone. (b) Representative image of histological immunofluorescence analysis of spleen of D10 SRBCi C57BL/6 wild-type mice. FDCs (CD35, Blue), BCL-6 (white), MYC (red). (c) Inset, dark zone and light zone boundary, white dashed line. White arrows, MYC positive cells. (d) Graphical representation of flow cytometry analysis of CD86, CD83 expression of non-GC B cells, and of D10N and D10P GC B cells. gMFI, geometrical mean fluorescence intensity, (mean and s.e.m.) (e) Graphical representation as in (d) of CD40, CD69 and MHCII expression. Data are presented as in (d). (f) Real-time PCR analysis of IγBa mRNA of flow sorted FO B cells and of D10N and D10P GC B cells. Data are presented relative to Hprt and normalized to FO B cells, (mean and s.e.m. of triplicates). (g) Real-time PCR analysis of Irf4 mRNA as in (f). Data are presented as in (f). (h) GSEA of D10 MYCEGFP positive and negative GC B cell gene expression profiles, for the MYC up-regulated (YU_MYC_TARGETS_UP, left panel) and downregulated (YU_MYC_TARGETS_DOWN, right panel) gene sets. See Methods for GSEA analysis details. Scale bar 25μm (c,d). Data are representative 3 (a-c, d,e) and 5 (f,g) independent experiments. ns, not statistically significant. * p≤0.05, ** p≤0.01, *** p≤0.001.
Figure 7
Figure 7. A large fraction of MYC positive mature GC B cells are in cell cycle, and these cells are essential for GC maintenance
(a) Real-time PCR analysis of Ccdn2 and Ccdn3 mRNA, of flow sorted FO and of day 10 MYCEGFP negative (D10N) and positive (D10P) GC B cells. Data are presented relative to Hprt and normalized to FO B cells, (mean and s.e.m. of triplicates). (b) Representative analysis by flow cytometry of the DNA of non-GC B cells and of D10N and D10P GC B cells. (c) Graphical representation of data presented in (b), (mean and s.e.m.) (d) Flow cytometry analysis of splenic GC B cells 13 days after SRBC immunization in mice of the indicated genotypes. Right panel analysis of reporter (hCD2) positive GC B cells. Data are representative of 5 (a), 3 (b, c) and 2 (d) independent experiments.

Comment in

Similar articles

Cited by

References

    1. MacLennan IC. Germinal centers. Annu Rev Immunol. 1994;12:117–139. - PubMed
    1. Liu YJ, Zhang J, Lane PJ, Chan EY, MacLennan IC. Sites of specific B cell activation in primary and secondary responses to T cell-dependent and T cell-independent antigens. Eur J Immunol. 1991;21:2951–2962. - PubMed
    1. de Alboran IM, et al. Analysis of C-MYC function in normal cells via conditional gene-targeted mutation. Immunity. 2001;14:45–55. - PubMed
    1. Vallespinos M, et al. B Lymphocyte commitment program is driven by the proto-oncogene c-Myc. J Immunol. 2011;186:6726–6736. - PubMed
    1. Shaffer AL, et al. Signatures of the immune response. Immunity. 2001;15:375–385. - PubMed

Publication types

MeSH terms

Substances

Associated data