

Excessive activation of mTOR in postnatally generated granule cells is sufficient to cause epilepsy
- PMID: 22998871
- PMCID: PMC3474536
- DOI: 10.1016/j.neuron.2012.08.002
Excessive activation of mTOR in postnatally generated granule cells is sufficient to cause epilepsy
Abstract
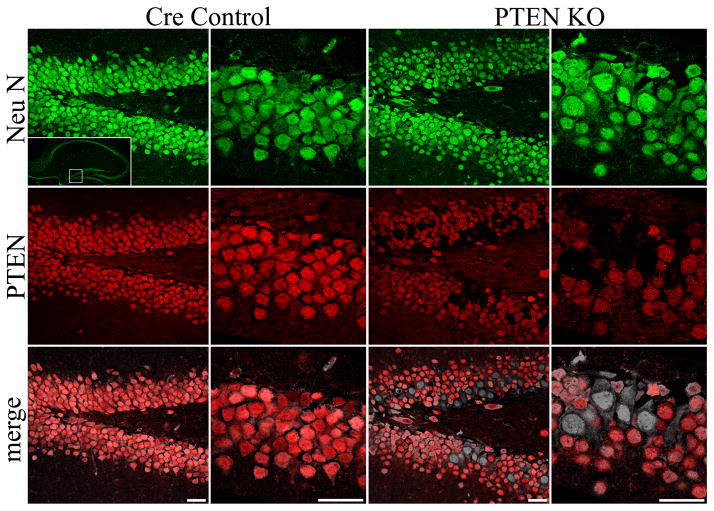
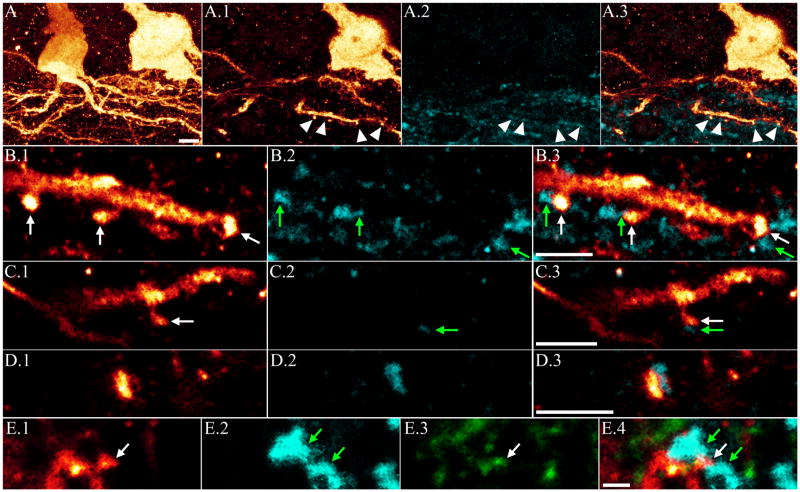
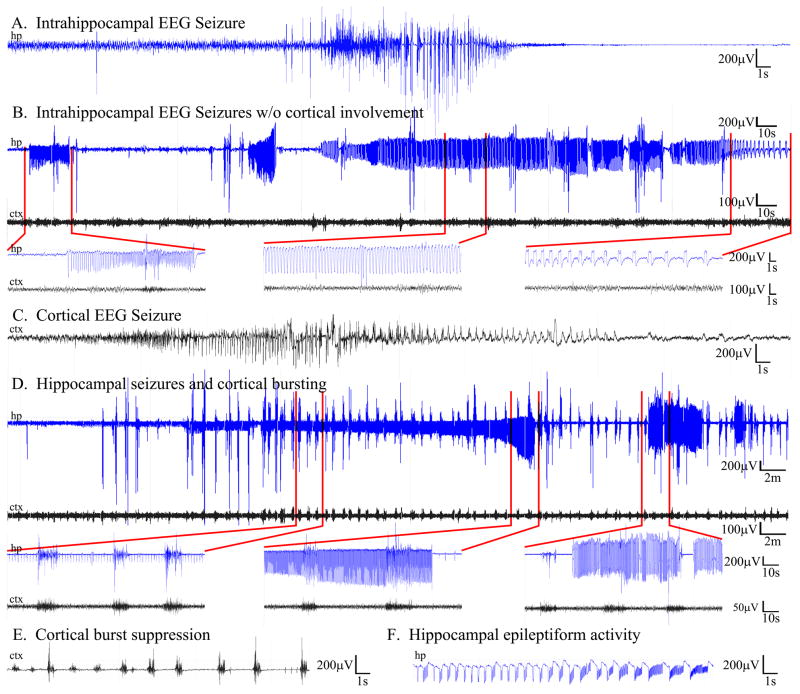
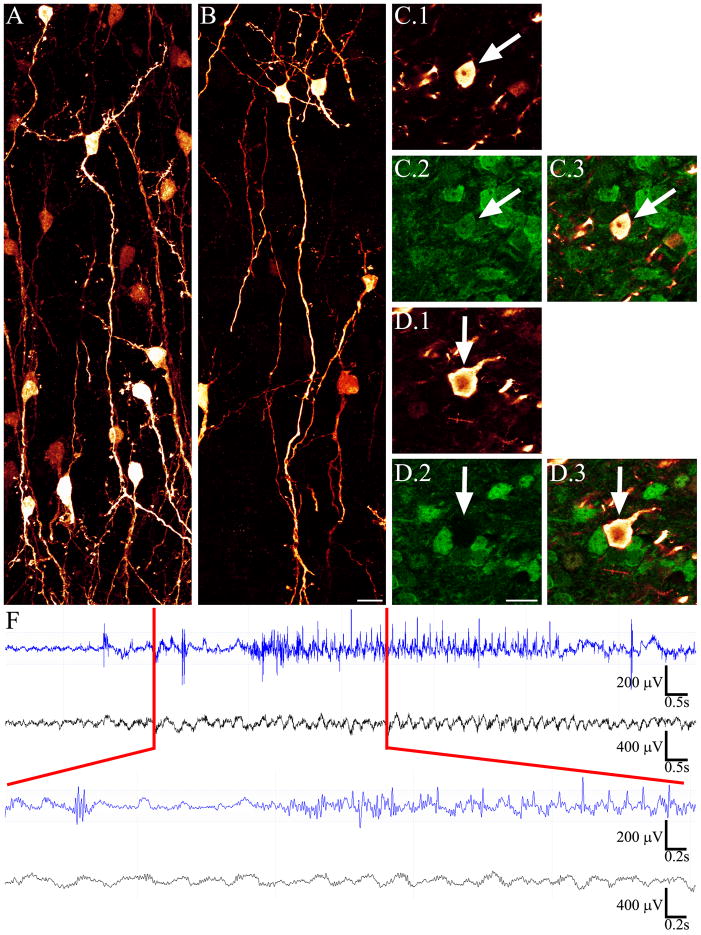
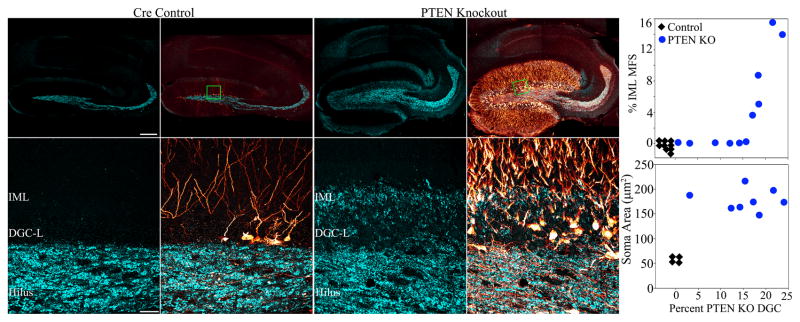
The dentate gyrus is hypothesized to function as a "gate," limiting the flow of excitation through the hippocampus. During epileptogenesis, adult-generated granule cells (DGCs) form aberrant neuronal connections with neighboring DGCs, disrupting the dentate gate. Hyperactivation of the mTOR signaling pathway is implicated in driving this aberrant circuit formation. While the presence of abnormal DGCs in epilepsy has been known for decades, direct evidence linking abnormal DGCs to seizures has been lacking. Here, we isolate the effects of abnormal DGCs using a transgenic mouse model to selectively delete PTEN from postnatally generated DGCs. PTEN deletion led to hyperactivation of the mTOR pathway, producing abnormal DGCs morphologically similar to those in epilepsy. Strikingly, animals in which PTEN was deleted from ≥ 9% of the DGC population developed spontaneous seizures in about 4 weeks, confirming that abnormal DGCs, which are present in both animals and humans with epilepsy, are capable of causing the disease.
Copyright © 2012 Elsevier Inc. All rights reserved.
Conflict of interest statement
The authors have no conflicts of interest to report.
Figures


Comment in
-
Pten-less dentate granule cells make fits.Neuron. 2012 Sep 20;75(6):938-40. doi: 10.1016/j.neuron.2012.09.008. Neuron. 2012. PMID: 22998860
Similar articles
-
Accumulation of abnormal adult-generated hippocampal granule cells predicts seizure frequency and severity.J Neurosci. 2013 May 22;33(21):8926-36. doi: 10.1523/JNEUROSCI.5161-12.2013. J Neurosci. 2013. PMID: 23699504 Free PMC article.
-
Disrupted hippocampal network physiology following PTEN deletion from newborn dentate granule cells.Neurobiol Dis. 2016 Dec;96:105-114. doi: 10.1016/j.nbd.2016.09.004. Epub 2016 Sep 3. Neurobiol Dis. 2016. PMID: 27597527 Free PMC article.
-
Impact of rapamycin on status epilepticus induced hippocampal pathology and weight gain.Exp Neurol. 2016 Jun;280:1-12. doi: 10.1016/j.expneurol.2016.03.015. Epub 2016 Mar 17. Exp Neurol. 2016. PMID: 26995324 Free PMC article.
-
Neuroanatomical clues to altered neuronal activity in epilepsy: from ultrastructure to signaling pathways of dentate granule cells.Epilepsia. 2012 Jun;53 Suppl 1(0 1):67-77. doi: 10.1111/j.1528-1167.2012.03477.x. Epilepsia. 2012. PMID: 22612811 Free PMC article. Review.
-
Chronic epileptogenic cellular alterations in the limbic system after status epilepticus.Epilepsia. 1999;40 Suppl 1:S23-33; discussion S40-1. doi: 10.1111/j.1528-1157.1999.tb00875.x. Epilepsia. 1999. PMID: 10421558 Review.
Cited by
-
Suppression of epileptogenesis-associated changes in response to seizures in FGF22-deficient mice.Front Cell Neurosci. 2013 Apr 18;7:43. doi: 10.3389/fncel.2013.00043. eCollection 2013. Front Cell Neurosci. 2013. Retraction in: Front Cell Neurosci. 2023 Aug 29;17:1279588. doi: 10.3389/fncel.2023.1279588 PMID: 23616746 Free PMC article. Retracted.
-
PI3K isoform-selective inhibition in neuron-specific PTEN-deficient mice rescues molecular defects and reduces epilepsy-associated phenotypes.Neurobiol Dis. 2020 Oct;144:105026. doi: 10.1016/j.nbd.2020.105026. Epub 2020 Jul 24. Neurobiol Dis. 2020. PMID: 32712265 Free PMC article.
-
PTEN deletion from adult-generated dentate granule cells disrupts granule cell mossy fiber axon structure.Neurobiol Dis. 2015 Mar;75:142-50. doi: 10.1016/j.nbd.2014.12.029. Epub 2015 Jan 17. Neurobiol Dis. 2015. PMID: 25600212 Free PMC article.
-
Synaptic hyperexcitability of cytomegalic pyramidal neurons contributes to epileptogenesis in tuberous sclerosis complex.Cell Rep. 2022 Jul 19;40(3):111085. doi: 10.1016/j.celrep.2022.111085. Cell Rep. 2022. PMID: 35858542 Free PMC article.
-
Adult neurogenesis in the mouse dentate gyrus protects the hippocampus from neuronal injury following severe seizures.Hippocampus. 2019 Aug;29(8):683-709. doi: 10.1002/hipo.23062. Epub 2019 Jan 23. Hippocampus. 2019. PMID: 30672046 Free PMC article.
References
-
- Ahn S, Joyner AL. Dynamic changes in the response of cells to positive hedgehog signaling during mouse limb patterning. Cell. 2004;118:505–516. - PubMed
-
- Ahn S, Joyner AL. In vivo analysis of quiescent adult neural stem cells responding to Sonic hedgehog. Nature. 2005;437:894–897. - PubMed
-
- Austin JE, Buckmaster PS. Recurrent excitation of granule cells with basal dendrites and low interneuron density and inhibitory postsynaptic current frequency in the dentate gyrus of macaque monkeys. J Comp Neurol. 2004;476(3):205–18. - PubMed
-
- Backman SA, Stambolic V, Suzuki A, Haight J, Elia A, Pretorius J, Tsao MS, Shannon P, Bolon B, Ivy GO, Mak TW. Deletion of Pten in mouse brain causes seizures, ataxia and defects in soma size resembling Lhermitte-Duclos disease. Nat Genet. 2001;29:396–403. - PubMed
Publication types
MeSH terms
Substances
Grants and funding
LinkOut - more resources
Full Text Sources
Medical
Molecular Biology Databases
Research Materials
Miscellaneous
