. 2014 Jan;24(1):67-80.
doi: 10.1093/cercor/bhs284. Epub 2012 Sep 20.

Homeostatic control of synaptic activity by endogenous adenosine is mediated by adenosine kinase

Affiliations

Homeostatic control of synaptic activity by endogenous adenosine is mediated by adenosine kinase

Maria José Diógenes et al. Cereb Cortex. 2014 Jan.

Abstract

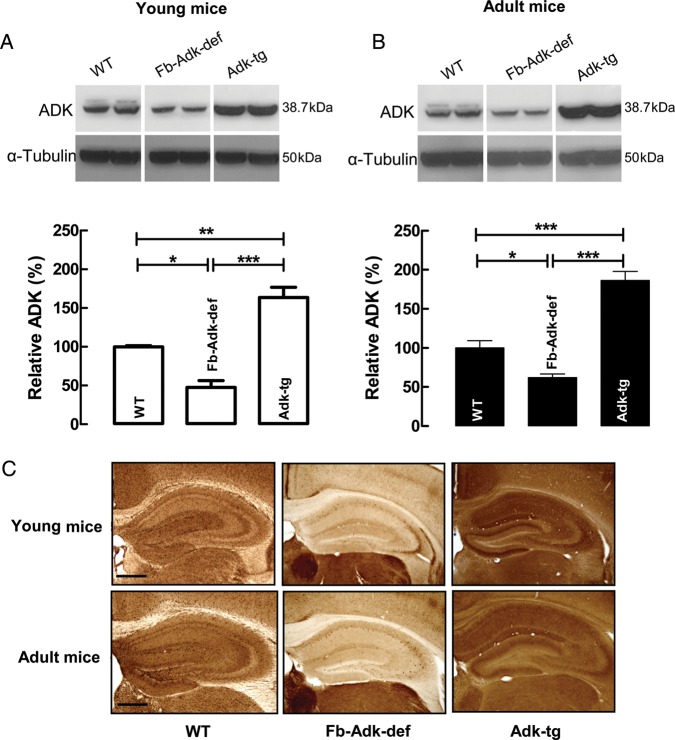
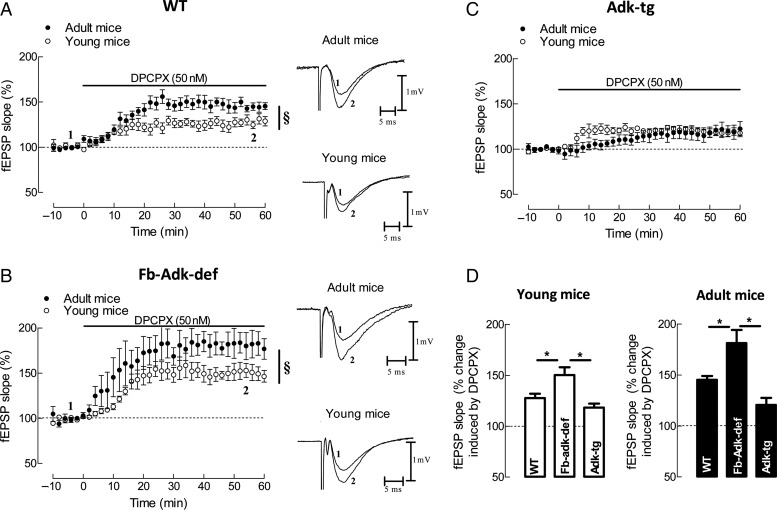
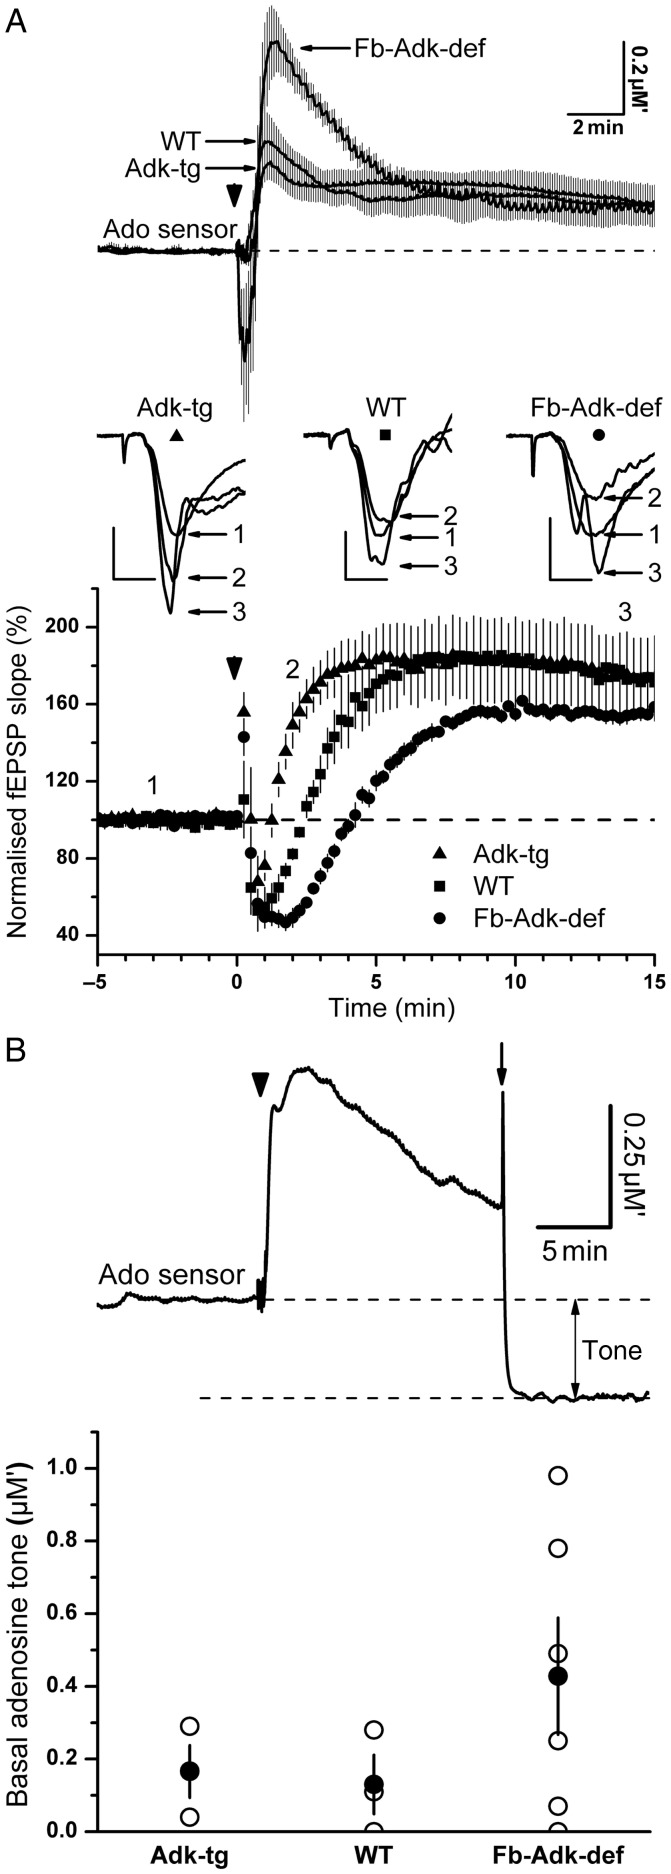
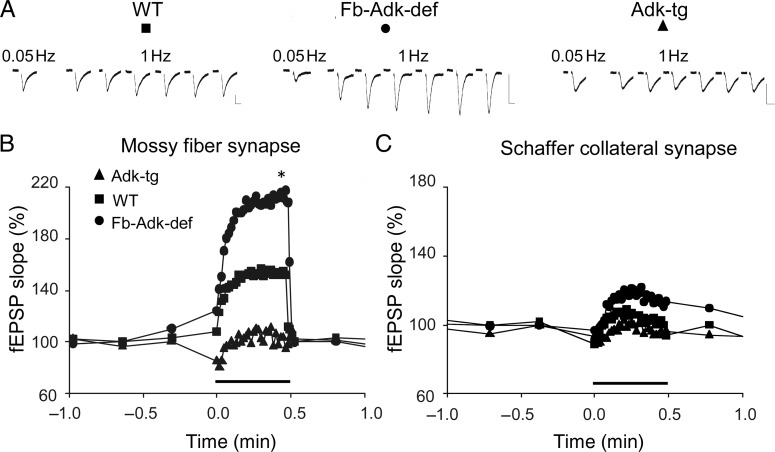
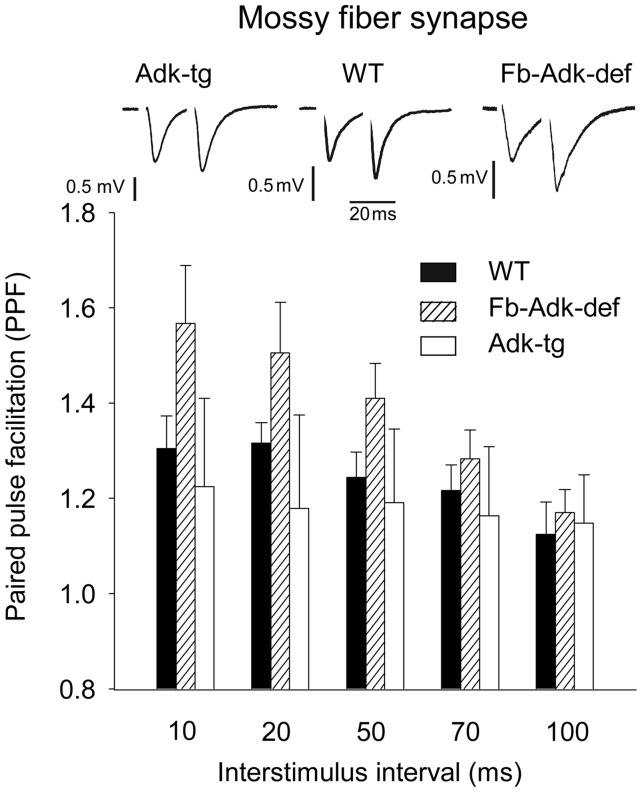
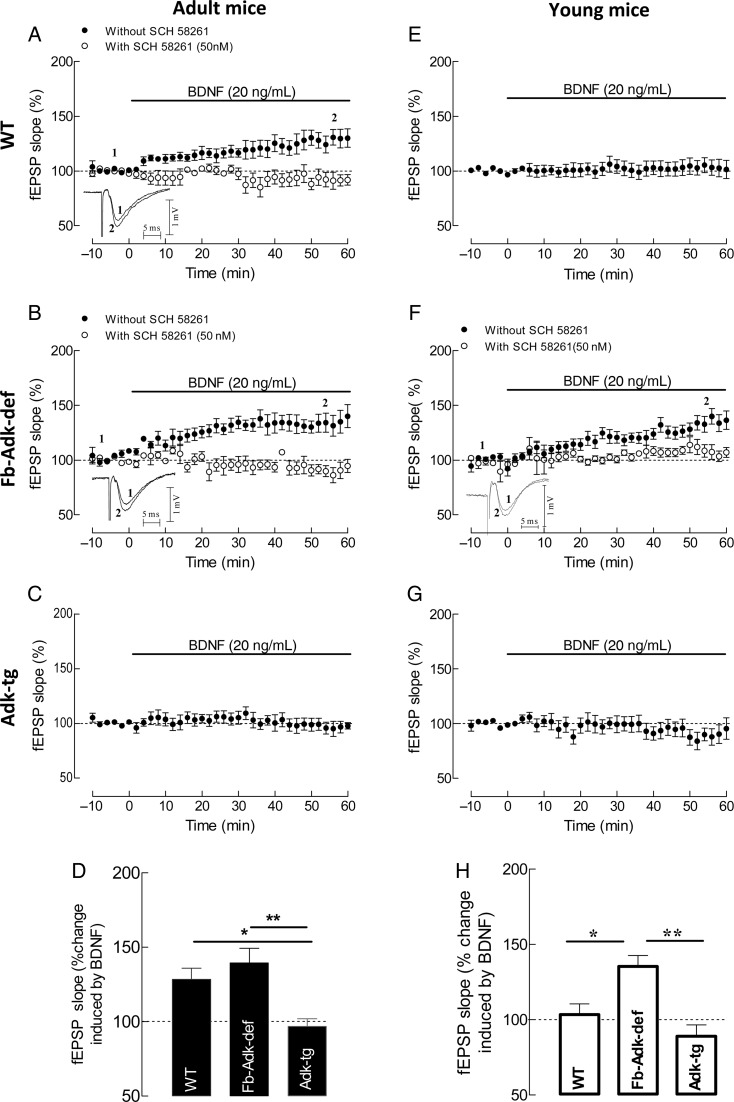
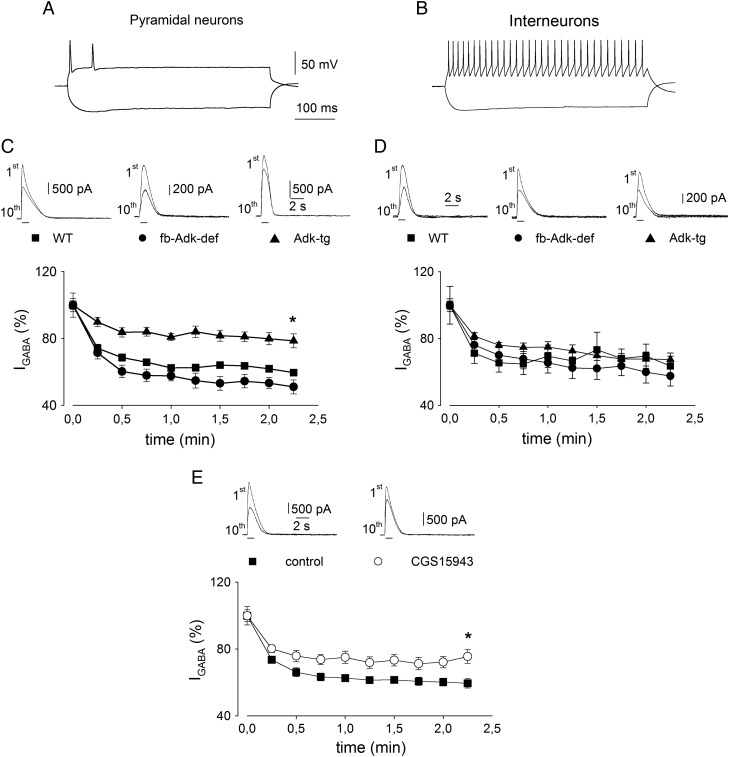
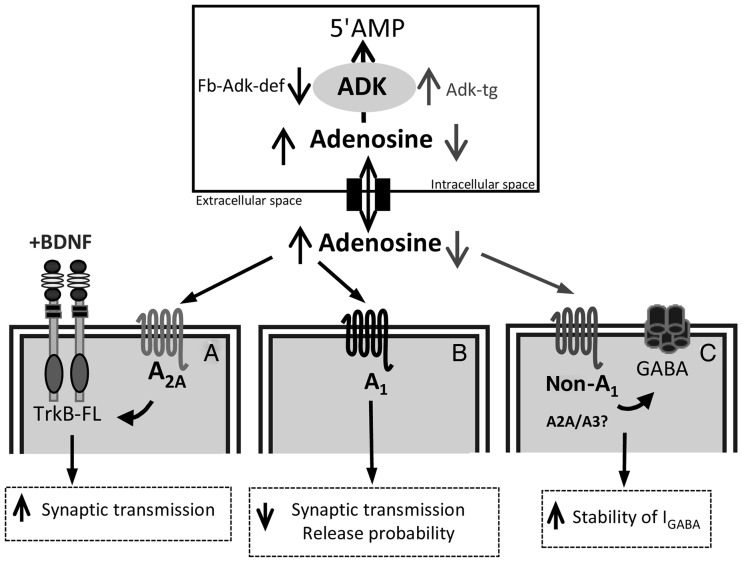
Extracellular adenosine, a key regulator of neuronal excitability, is metabolized by astrocyte-based enzyme adenosine kinase (ADK). We hypothesized that ADK might be an upstream regulator of adenosine-based homeostatic brain functions by simultaneously affecting several downstream pathways. We therefore studied the relationship between ADK expression, levels of extracellular adenosine, synaptic transmission, intrinsic excitability, and brain-derived neurotrophic factor (BDNF)-dependent synaptic actions in transgenic mice underexpressing or overexpressing ADK. We demonstrate that ADK: 1) Critically influences the basal tone of adenosine, evaluated by microelectrode adenosine biosensors, and its release following stimulation; 2) determines the degree of tonic adenosine-dependent synaptic inhibition, which correlates with differential plasticity at hippocampal synapses with low release probability; 3) modulates the age-dependent effects of BDNF on hippocampal synaptic transmission, an action dependent upon co-activation of adenosine A2A receptors; and 4) influences GABAA receptor-mediated currents in CA3 pyramidal neurons. We conclude that ADK provides important upstream regulation of adenosine-based homeostatic function of the brain and that this mechanism is necessary and permissive to synaptic actions of adenosine acting on multiple pathways. These mechanistic studies support previous therapeutic studies and implicate ADK as a promising therapeutic target for upstream control of multiple neuronal signaling pathways crucial for a variety of neurological disorders.

Keywords: GABA; adenosine; brain-derived neurotrophic factor; homeostasis; transgenic mice.


Figures

Figure 1.
Figure 1.
Genotype-specific ADK immunoreactivity in the mouse brain. (A and B) Western blot analysis of ADK immunoreactivity (38.7 kDa) from the hippocampus and dorsal cortex taken from young (A, 3–5 weeks old) or adult (B, 10–12 weeks old) mice. α-Tubulin immunoreactivity (50 kDa) was used as a loading control. The 3 different genotypes, WT, Fb-Adk-def, and Adk-tg, are indicated above each lane. Each blot shows data from 2 different animals of the same genotype and age. The quantitative analysis shows averaged data normalized to the loading control and to WT. Data were calculated based on multiple samples taken from different ages and genotypes (young: WT, n = 5; Fb-Adk-def, n = 4; Adk-tg, n = 8; adult: WT, n = 6; Fb-Adk-def, n = 6; Adk-tg, n = 7); data are presented as mean ± SEM. (C) Immunohistochemical analysis of coronal brain sections of the hippocampus from WT, Fb-Adk-def, and Adk-tg mice (young [upper panel] and adult [lower panel]); sections were stained with diaminobenzidine hydrochloride (DAB) for ADK immunoreactivity; scale bar: 500 µm. *P < 0.05, **P < 0.01, and ***P < 0.001 (one-way ANOVA with Bonferroni's multiple comparison test).
Figure 2.
Figure 2.
Influence of genotype upon A1R-mediated tonic inhibition of synaptic transmission at CA3/CA1 hippocampal synapses. The selective A1R antagonist, DPCPX (50 nM) was used to block A1R-mediated tonic inhibition of synaptic transmission. (AC) Averaged time courses of changes in fEPSP slope induced by application of DPCPX in slices taken from young (A, open circle, n = 6) and adult (A, filled circle, n = 7) WT, young (B, open circle, n = 4) and adult (B, filled circle, n = 4) Fb-Adk-def mice, and young (C, open circle, n = 5) and adult (C, filled circle, n = 6) Adk-tg mice. Right panels in (A) and (B) show illustrative fEPSP traces obtained immediately before (1) and during (2) DPCPX application; each trace is the average of 8 consecutive responses and the fEPSP is preceded by the stimulus artifact and the presynaptic volley; the stimulus artifact has been truncated in amplitude. (D) Comparison of the averaged effects of DPCPX in the different genotypes within each age group. §P < 0.05 (Student's t-test) and *P < 0.05 (one-way ANOVA with Bonferroni's multiple comparison test).
Figure 3.
Figure 3.
Influence of genotype upon the basal and activity-dependent increase in extracellular adenosine levels, as measured with a microelectrode adenosine biosensor. (A) Upper panel, adenosine release in response to repeated TBS (15 bursts of 4 pulses at 100 Hz separated by 200 ms, repeated 4 times at 10 s intervals; arrowhead) in slices from WT (n = 5), Fb-Adk-def (n = 8), and Adk-tg (n = 6) mice. Note much greater release of adenosine in slices from mice deficient in ADK and reduced peak adenosine release in slices from mice overexpressing ADK. Traces represent mean ± SEM. Lower panel, the time course of simultaneously recorded fEPSPs from the experiments shown in the upper panel. TBS at time zero resulted in a transient depression of the fEPSP in WT slices (squares, n = 5), which was longer in slices from mice deficient in ADK (circles, n = 8), likely reflecting enhanced release of adenosine (upper traces), while the depression was shorter lasting in slices overexpressing ADK (triangles, n = 6). Inset are fEPSPs from the 3 genotypes taken at the times indicated by the numbers 1, 2, and 3 before TBS, ∼2 min after TBS, and ∼14 min after TBS, respectively. Note at 2 min, the individual fEPSPs reflect the pooled data demonstrating (from left to right): The enhancement of the fEPSP in Adk-tg slices above the preceding control fEPSPs, return of WT fEPSPs to close to control, and continued depression of fEPSPs from Fb-Adk-def slices relative to control fEPSPs. Symbols below the genotype refer to the corresponding traces in the fEPSP time course plot. Scale bars for fEPSPs measure 0.5 mV and 5 ms. (B) Upper trace shows the representative experiment of basal tone measurement where the adenosine sensor was removed from the slice (arrow) 15 min after TBS (arrowhead). The difference between the preceding sensor baseline and the background sensor current is taken as an estimate of the basal adenosine tone. The lower bar graph provides the mean ± SEM (filled circle) and individual tone measurements (open circles) from WT (n = 3), Adk-tg (n = 3), and Fb-Adk-def (n = 6) slices. Values of adenosine are provided in µM′ to indicate that this is a composite signal reflecting adenosine and its metabolites (inosine and hypoxanthine).
Figure 4.
Figure 4.
Frequency facilitation depends on ADK level at mossy fiber but not at Schaffer collateral synapses. (A and B) 1-Hz facilitation at mossy fibers in hippocampal slices. (A) Representative traces recorded during 0.05 and 1 Hz stimulation (one every 5 s), as indicated, in WT, Fb-Adk-def, and Adk-tg. Vertical bars: 2 mV, horizontal bars: 10 ms. (B) The average time course of fEPSP slope from WT (filled square, n = 6), Fb-Adk-def (filled circle, n = 6), and Adk-tg (filled triangle, n = 6) mice, as indicated. At the time indicated by the horizontal bar, stimulus frequency was increased from 0.05 to 1 Hz for 30 s. (C) Average time course of 1-Hz fEPSP slope facilitation at Schaffer collateral synapse for the same genotypes as indicated in (B) (n = 4 for each genotype); symbols as in (B); note the limited facilitation following 1-Hz stimulation, in contrast with the facilitation shown in (A and B). *P < 0.05, Fb-Adk-def versus Adk-tg (Student's t-test).
Figure 5.
Figure 5.
ADK expression influences PPF at mossy fiber synapses. PPF measured at different interstimuli intervals. (Upper panel) Typical traces recorded at 20 ms of interstimulus in the different genotypes, as indicated. Vertical bars: 0.5 mV, horizontal bar: 20 ms. (Lower panel) Histograms of PPF at interstimulus of 10, 20, 50, 70, and 100 ms. The ordinates refer to an average value of PPF measured as a ratio between the second and the first fEPSP slope responses in hippocampal slices from WT (n = 7), Fb-Adk-def (n = 7), and Adk-tg (n = 5) mice, as indicated.
Figure 6.
Figure 6.
ADK expression influences A2AR-dependent facilitatory effect of BDNF on synaptic transmission depending on the age of the animals. (AC and EG) Averaged time courses of changes in fEPSP slope induced by application of 20 ng/mL (corresponding to ∼0.8 nM) BDNF in slices taken from 10- to 12-week WT (A, filled circle, n = 7), Fb-Adk-def (B, filled circle, n = 5), and Adk-tg (C, filled circle, n = 6) mice or from 3- to 5-week WT (E, filled circle, n = 8), Fb-Adk-def (F, filled circle, n = 9), and Adk-tg (G, filled circle, n = 6) mice. A (open circle, n = 5), B (open circle, n = 4), and F (open circle, n = 6) also illustrate the blockade of the effect of BDNF upon the blockade of A2AR with the selective antagonist, SCH 58261 (50 nM), which by itself did not influence fEPSPs, as it did not affect the absence of the effect of BDNF in hippocampal slices from Fb-Adk-tg mice. A, B, and F, as an inset of the time course graph, are shown illustrative fEPSP traces obtained immediately before (1) and during (2) BDNF application; each trace is the average of 8 consecutive responses and the fEPSP is preceded by the stimulus artifact and the presynaptic volley; the stimulus artifact has been truncated in amplitude. (D and H) Comparison of the averaged effects of BDNF (change in fEPSP slope at 50–60 min) in the different genotypes in relation to pre-BDNF values (100%) from experiments shown in (AC) and (EG) as indicated in each column. All values are mean ± SEM. *P < 0.05 and **P < 0.001 (one-way ANOVA with Bonferroni's multiple comparison test).
Figure 7.
Figure 7.
High ADK expression is associated with increased IGABA stability upon repetitive GABA application on CA3 pyramidal neurons. (A) Typical trace showing action potential properties in a current-clamped WT CA3 pyramidal neuron. Note the marked action potential accommodation. Current intensity: 100 pA. (B) Typical trace showing action potential properties in a current-clamped WT CA3 interneuron. Current intensity, 100 pA. Note lack of accommodation and marked after hyperpolarization. (C) (Top) Typical traces showing 1st and 10th IGABA evoked by repetitive pressure application of 100 µM GABA (horizontal bars; 0 mV holding potential) in WT (filled square), Fb-Adk-def (filled circle), and Adk-tg (filled triangle) CA3 pyramidal neurons, as indicated. (Bottom) Average time courses of IGABA evoked by repetitive GABA applications (1 s duration every 15 s), in WT (n = 11), Fb-Adk-def (n = 7), and Adk-tg (n = 7) CA3 pyramidal neurons, as indicated. Note higher IGABA stability significantly associated with Adk-tg neurons (P < 0.05). (D) (Top) Typical traces showing 1st and 10th IGABA evoked by repetitive application of GABA in WT (filled square), Fb-Adk-def (filled circle), and Adk-tg (filled triangle) CA3 interneurons, as indicated. (Bottom) Average time courses of IGABA evoked by repetitive GABA applications in WT (n = 7), Fb-Adk-def (n = 8), and Adk-tg (n = 7) CA3 interneurons, as indicated. (E) The blockade of adenosine receptors inhibits the activity-dependent IGABA decrease in Fb-Adk-def CA3 pyramidal neurons. (Top) Typical traces showing 1st and 10th IGABA evoked by repetitive pressure application of GABA 100 µM (horizontal bars; 0 mV holding potential) before (filled circle) and during (open circle) the application of the adenosine receptors blocker CGS 15943 100 nM, as indicated. (Bottom) Average time courses of IGABA evoked by repetitive GABA applications observed in the same cells before (filled circle, n = 7) and during (open circle) the administration of CGS 15943. Note higher IGABA stability in the presence of CGS 15943 (P < 0.05).
Figure 8.
Figure 8.
Schematic diagram summarizing the main conclusion that regulation of endogenous adenosine tone by adenosine kinase exerts homeostatic control over synaptic activity. ADK, by phosphorylating intracellular adenosine to 5′AMP, maintains an inward adenosine gradient, driving adenosine influx into the cell. When ADK levels are increased (Adk-tg mice), adenosine levels decrease, whereas reduced ADK levels (Fb-Adk-def) lead to increased extracellular adenosine concentration. ADK, by regulating the extracellular tone of adenosine, exerts upstream control over 3 major adenosine-dependent pathways: (A) A2AR-dependent promotion of BDNF-signaling, (B) A1R-dependent inhibition of synaptic transmission and plasticity, and (C) adenosine receptor-dependent modulation of GABAergic currents. When animals have reduced levels of ADK (Fb-ADK-def), the increased levels of adenosine facilitate BDNF actions upon synaptic transmission through the activation of A2AR (A) and inhibit synaptic transmission through A1R (B), this inhibition leading to a marked enhancement of short-term synaptic plasticity at low release probability synapses. When ADK levels are increased (Adk-tg), the decreased levels of adenosine increase the stability of IGABA via non-A1R (C).

Similar articles

Cited by

References

    1. Anderson WW, Collingridge GL. The LTP Program: A data acquisition program for on-line analysis of long-term potentiation and other synaptic events. J Neurosci Methods. 2001;108:71–83. doi:10.1016/S0165-0270(01)00374-0. - DOI - PubMed
    1. Aronica E, Zurolo E, Iyer A, de Groot M, Anink J, Carbonell C, van Vliet EA, Baayen JC, Boison D, Gorter JA. Upregulation of adenosine kinase in astrocytes in experimental and human temporal lobe epilepsy. Epilepsia. 2011;52:1645–1655. doi:10.1111/j.1528-1167.2011.03115.x. - DOI - PMC - PubMed
    1. Assaife-Lopes N, Sousa VC, Pereira DB, Ribeiro JA, Chao MV, Sebastião AM. Activation of adenosine A2A receptors induces TrkB translocation and increases BDNF-mediated phospho-TrkB localization in lipid rafts: Implications for neuromodulation. J Neurosci. 2010;30:8468–8480. doi:10.1523/JNEUROSCI.5695-09.2010. - DOI - PMC - PubMed
    1. Boison D. Adenosine augmentation therapies (AATs) for epilepsy: Prospect of cell and gene therapies. Epilepsy Res. 2009;85:131–141. doi:10.1016/j.eplepsyres.2009.03.019. - DOI - PMC - PubMed
    1. Boison D, Chen JF, Fredholm BB. Adenosine signaling and function in glial cells. Cell Death Differ. 2010;17:1071–1082. doi:10.1038/cdd.2009.131. - DOI - PMC - PubMed

Publication types

MeSH terms