. 2012 Sep 17;198(6):1025-37.
doi: 10.1083/jcb.201202137.

INF2 promotes the formation of detyrosinated microtubules necessary for centrosome reorientation in T cells

Affiliations

INF2 promotes the formation of detyrosinated microtubules necessary for centrosome reorientation in T cells

Laura Andrés-Delgado et al. J Cell Biol. .

Abstract

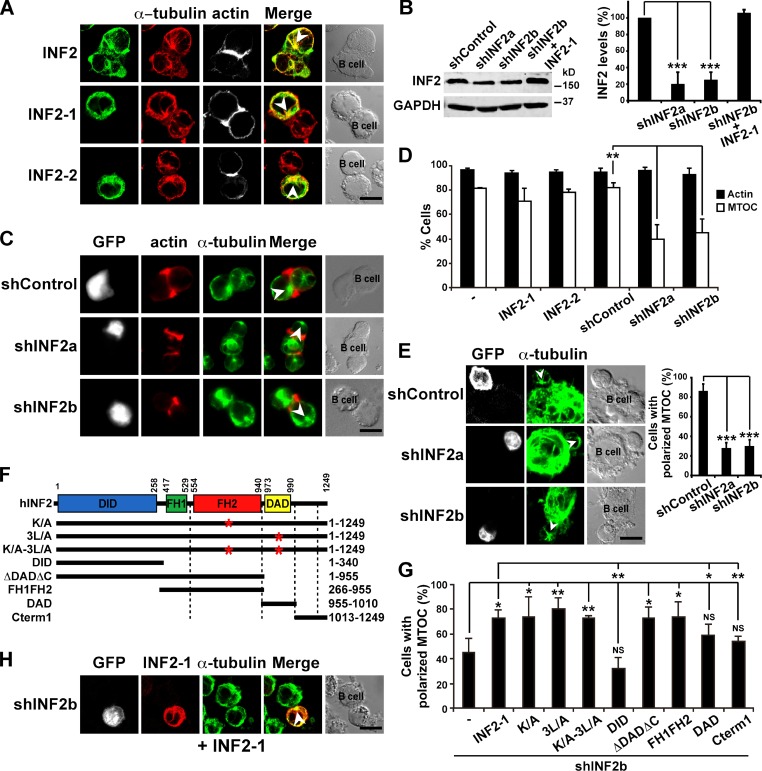
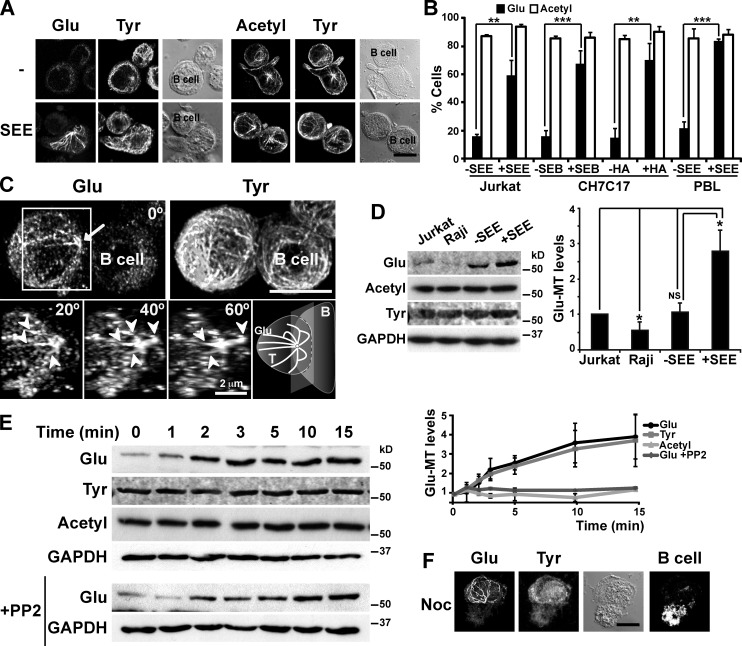
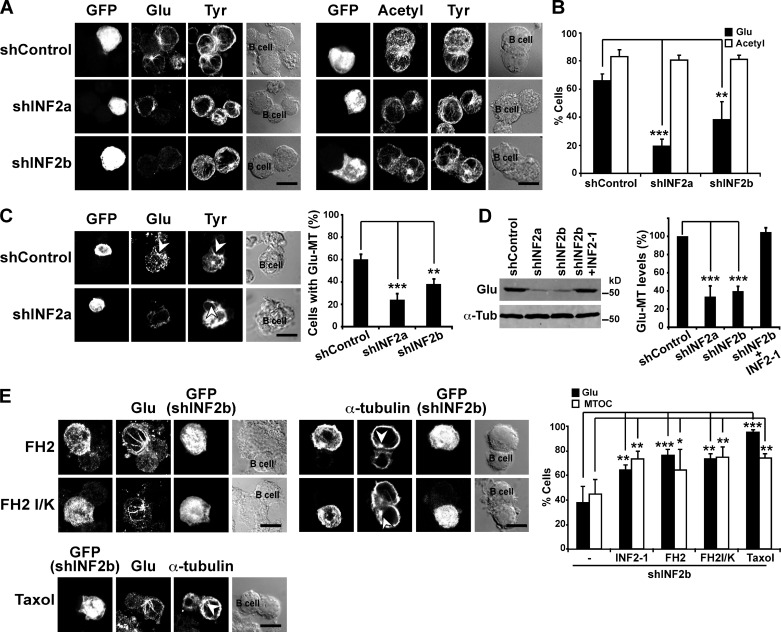
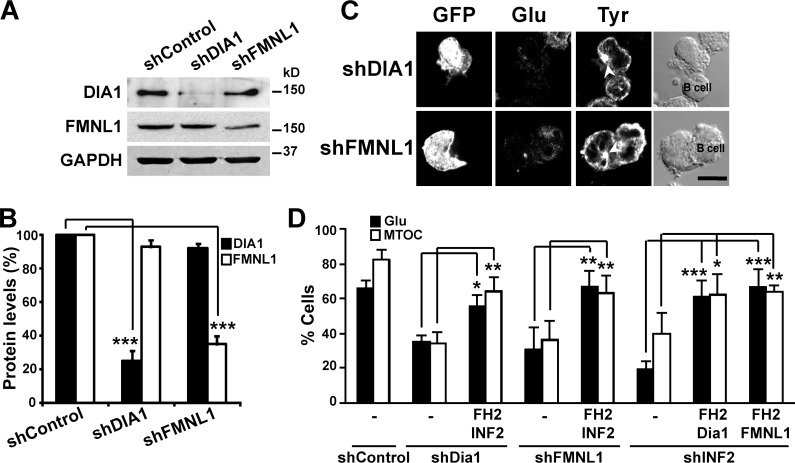
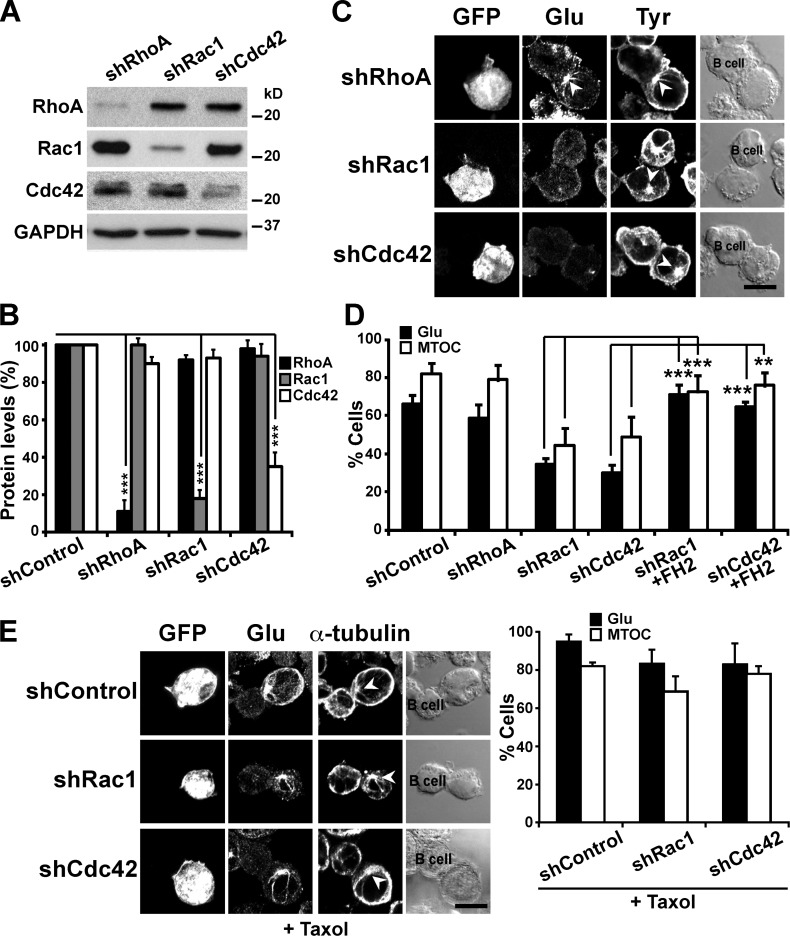
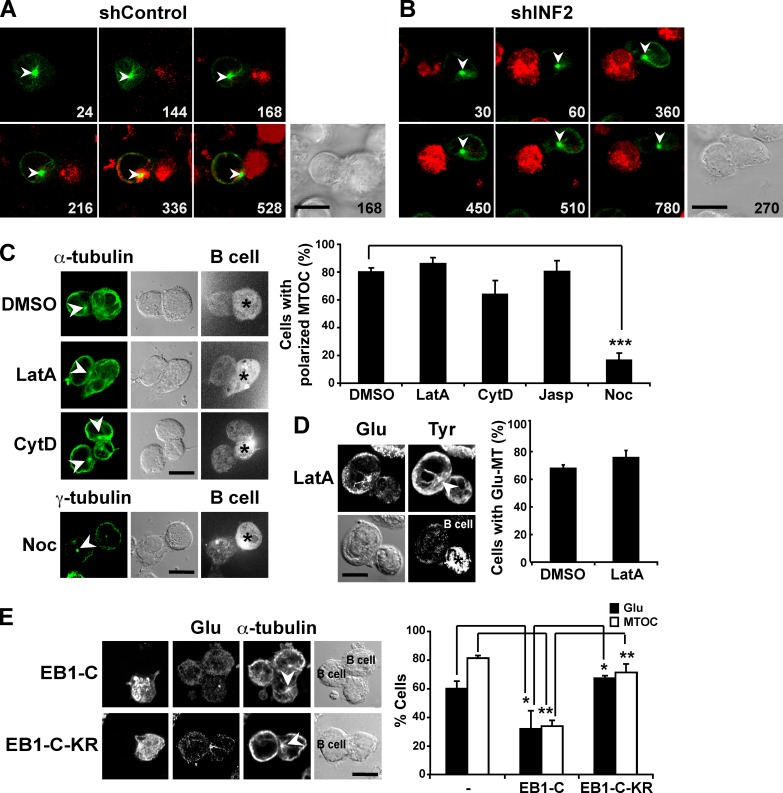
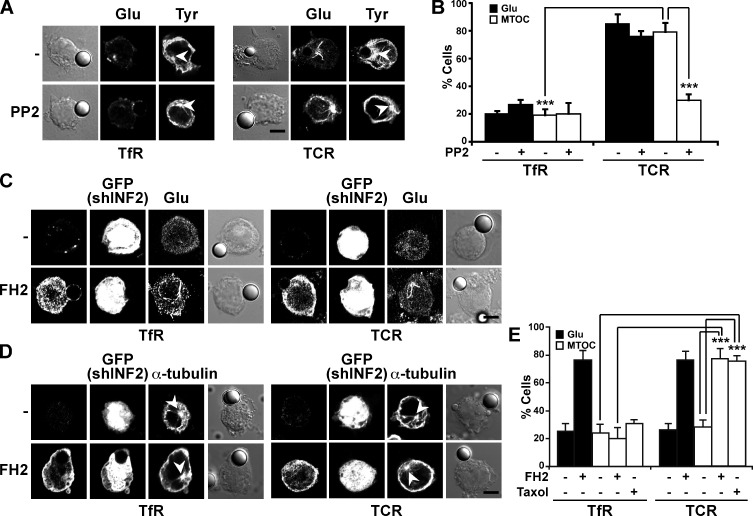
T cell antigen receptor-proximal signaling components, Rho-family GTPases, and formin proteins DIA1 and FMNL1 have been implicated in centrosome reorientation to the immunological synapse of T lymphocytes. However, the role of these molecules in the reorientation process is not yet defined. Here we find that a subset of microtubules became rapidly stabilized and that their α-tubulin subunit posttranslationally detyrosinated after engagement of the T cell receptor. Formation of stabilized, detyrosinated microtubules required the formin INF2, which was also found to be essential for centrosome reorientation, but it occurred independently of T cell receptor-induced massive tyrosine phosphorylation. The FH2 domain, which was mapped as the INF2 region involved in centrosome repositioning, was able to mediate the formation of stable, detyrosinated microtubules and to restore centrosome translocation in DIA1-, FMNL1-, Rac1-, and Cdc42-deficient cells. Further experiments indicated that microtubule stabilization was required for centrosome polarization. Our work identifies INF2 and stable, detyrosinated microtubules as central players in centrosome reorientation in T cells.


Figures

Figure 1.
Figure 1.
INF2 is required for MTOC reorientation in Jurkat cells and primary T cells. (A) Control Jurkat cells (top) and Jurkat cells transiently expressing exogenous, tagged INF2-1 (middle) or INF2-2 (bottom) were conjugated to SEE-loaded APCs. The distribution of α-tubulin, F-actin, and endogenous (top) or exogenous INF2 (middle and bottom) was analyzed. (B–D) Jurkat cells were transfected with DNA constructs coexpressing GFP and shControl, shINF2a, or shINF2b. Cells were processed for immunoblotting with anti-INF2 or anti-GAPDH (GAPDH) antibodies. The histogram represents the percentage of INF2 content (B). Cells were conjugated to SEE-loaded APCs and stained for F-actin and α-tubulin (C). The histogram represents the percentage of T cells with F-actin or MTOC polarized to the IS (D). (E) Peripheral blood lymphocytes transfected with a DNA construct coexpressing GFP and shControl, shINF2a, or shINF2b were conjugated to SEE-loaded APCs and stained for α-tubulin. The histogram represents the percentage of T cells with MTOC polarized to the IS. (F and G) Jurkat cells transiently expressing intact INF2 or the indicated INF2 mutants (F) were transfected with a DNA construct coexpressing GFP and shINF2b. Cells were conjugated to SEE-loaded APCs and the position of the MTOC was analyzed. The histogram represents the percentage of T cells with MTOC polarized to the IS (G). (H) Jurkat cells transiently expressing INF2-1 were transfected with a DNA construct coexpressing GFP and shINF2b. Cells were conjugated to SEE-loaded APCs and stained for INF2-1 and α-tubulin. The arrowheads indicate the position of the MTOC of the T cells. The p-value for the results of DID, DAD, and Cterm1 expression in INF2 KD cells relative to that of INF2 KD cells was of 0.102, 0.086, and 0.138, respectively (G). At least 40 T cells were analyzed in D, E, and G. Quantitative data in B, D, E, and G are summarized as means ± SEM from three independent experiments (error bars; NS, not significant; *, P < 0.05; **, P < 0.01; ***, P < 0.001). Bars, 5 µm.
Figure 2.
Figure 2.
Glu-MTs are rapidly induced after T cell stimulation. (A and B) Jurkat cells (A and B), CH7C17 Jurkat cells (B), or peripheral blood lymphocytes (PBL; B) were conjugated to APCs loaded or not with SEE, SEB, or hemagglutinin (HA) peptide as indicated. The distribution of Glu-, Tyr-, and acetyl-MTs was analyzed with specific antibodies (A). The histogram represents the percentage of T cells with Glu- or acetyl-MTs (B). (C) Conjugates formed by Jurkat cells with SEE-loaded Raji cells were stained for Glu- and Tyr-MTs. The images were analyzed under a confocal microscope and the resulting stacks were deconvolved and subsequently reconstructed in 3D. Views of the cell-to-cell contact rotated 0°, 20°, 40°, and 60° are shown for Glu-MT–stained cells in one conjugate. The arrow indicates the position of the MTOC and the arrowheads point to Glu-MTs that bend away from the IS following the T cell curvature. (D) Equal numbers of Jurkat and Raji cells or Jurkat cells conjugated to Raji cells loaded or not loaded with SEE as indicated were processed for immunoblotting for Glu-, acetyl-, and Tyr-tubulin, or for GAPDH as a loading control. The histogram represents Glu-MT levels relative to control Jurkat cells. (E) Jurkat cells were conjugated to latex beads coated with anti-TCR antibodies for the indicated times in the presence or absence of 2.5 µM PP2. Cells were analyzed by immunoblotting for Glu-, acetyl-, and Tyr-tubulin or for GAPDH. The graphics represents the levels of Glu-, Tyr-, and acetyl-tubulin at different times of conjugation relative to those at zero time. (F) Distribution of Glu- and Tyr-MTs in Jurkat cells conjugated to SEE-loaded APCs for 15 min and then treated with 2 µM nocodazole for 30 min. At least 40 T cells were analyzed in B. Quantitative data in B, D, and E are summarized as means ± SEM from three independent experiments (error bars; *, P < 0.05; **, P < 0.01; ***, P < 0.001). Bars, 5 µm.
Figure 3.
Figure 3.
INF2 is required for Glu-MT formation in T cells. (A and B) Jurkat cells were transfected with DNA constructs coexpressing GFP and shControl, shINF2a, or shINF2b. Cells were conjugated to SEE-loaded APCs and stained for Glu- and Tyr-MTs or acetyl- and Tyr-MTs, as indicated (A). The histogram represents the percentage of T cells with Glu- or acetyl-MTs (B). (C) Primary T cells were transfected with DNA constructs coexpressing GFP and shControl, shINF2a, or shINF2b. Cells were then conjugated to SEE-loaded APCs and stained for Glu- and Tyr-MTs. The histogram represents the percentage of T cells with Glu-MTs. (D) Jurkat cells expressing shControl, shINF2a, shINF2b, or shINF2b and exogenous INF2-1 were conjugated to SEE-loaded APCs and immunoblotted for Glu- or total α-tubulin. The histogram represents the percentage of Glu-tubulin content. (E) Jurkat cells expressing GFP and shINF2b from the same plasmid were either cotransfected with DNA constructs expressing the intact FH2 domain of INF2 or the I/K mutant, or were treated with 3 nM taxol for 18 h. Cells were then conjugated with SEE-loaded APCs, fixed with methanol, and stained for the expressed INF2 FH2 fragment and for Glu- or total α-tubulin, as indicated. The histogram represents the percentage of T cells with Glu-MTs or with polarized MTOC. The arrowheads in C and E indicate the position of the MTOC of the T cells. At least 40 T cells were analyzed in B, C, and E. Quantitative data in B–E are summarized as means ± SEM from three independent experiments (error bars; *, P < 0.05; **, P < 0.01; ***, P < 0.001). Bars, 5 µm.
Figure 4.
Figure 4.
FH2 domain expression allows Glu-MT formation and MTOC polarization in DIA1, FMNL1, or INF2 KD cells. (A and B) Jurkat cells were transfected with DNA constructs coexpressing GFP and shDIA1 or shFMNL1. Cells were immunoblotted for Dia1, FMNL1, or GAPDH (A). The histogram represents the percentage of DIA1 or FMNL1 content (B). (C and D) DIA1-, FMNL-1 (C), or INF2-KD cells were left untransfected or were transfected with constructs expressing the indicated FH2 domains (D). After conjugation to SEE-loaded APCs, cells were stained for Glu- and Tyr-MTs. The arrowheads indicate the position of the MTOC of the T cells. The histogram represents the percentage of T cells with Glu-MTs or polarized MTOC (D). Bars, 5 µm. At least 40 T cells were analyzed in D. Data in B and D are summarized as means ± SEM from three independent experiments (error bars; *, P < 0.05; **, P < 0.01; ***, P < 0.001).
Figure 5.
Figure 5.
The expression of the FH2 domain of INF2 restores Glu-MT formation and MTOC polarization in Rac1- or Cdc42-KD cells. (A and B) Jurkat cells were transfected with DNA constructs coexpressing GFP and shRhoA, shRac1, or shCdc42, and were immunoblotted for RhoA, Rac1, Cdc42, or GAPDH (A). The histogram represents the percentage of RhoA, Rac1, and Cdc42 content (B). (C and D) RhoA-, Rac1-, or Cdc42-KD cells were left untransfected (C and D) or were transfected with the construct expressing the FH2 domain of INF2 as indicated (D). After conjugation to SEE-loaded APCs, cells were stained for Glu- and Tyr-MTs (C). The histogram represents the percentage of T cells with Glu-MTs or with polarized MTOC (D). (E) Control, Rac1-KD, or Cdc42-KD cells were treated with 3 nM taxol for 18 h. After conjugation to SEE-loaded APCs, cells were stained for Glu- and α-tubulin. The histogram represents the percentage of T cells with Glu-MTs or polarized MTOC (E). The arrowheads indicate the position of the MTOC of the T cells. At least 40 T cells were analyzed in D and E. Data in B, D, and E are summarized as means ± SEM from three independent experiments (error bars; *, P < 0.05; **, P < 0.01; ***, P < 0.001). Bars, 5 µm.
Figure 6.
Figure 6.
MTs do not polarize to the contact site in INF2 KD cells. (A and B) Control (A) or INF2 KD Jurkat cells (B) expressing GFP-tubulin were conjugated to SEE-loaded APCs and subjected to time-lapse video microscopy. Numbers indicate time in seconds. (C) Jurkat cells were treated with 0.1% DMSO, 1 µM latrunculin A (LatA), 2.5 µM cytochalasin D (CytD), 0.5 µM jasplakinolide (Jasp), or 10 µm nocodazole (Noc) for 1 h. Cells were conjugated in the presence of the drugs to SEE-loaded APCs and were stained for α- or γ-tubulin as indicated. APCs (B cells) were stained with CMTMR. Note that the CMTMR stain from B cells diffuses into the medium, resulting in some background staining of T cells. The CMTMR images were subjected to nonlinear adjustment to help B cell identification. CMTMR-positive cells are marked with an asterisk. The histogram represents the percentage of T cells with polarized MTOC. (D) Jurkat cells were treated with 1 µM latrunculin A and conjugated in the presence of the drug to SEE-loaded APCs that were stained with CMTMR. Cells were finally stained for Glu- and Tyr-MTs. The histogram represents the percentage of T cells with Glu-MTs. (E) Control or Jurkat cells expressing EB1-C-GFP or EB1-C-KR-GFP were conjugated to SEE-loaded APCs. Cells were then stained for Glu-MT and α-tubulin. The histogram represents the percentage of transfected T cells with Glu-MTs or polarized MTOC. The arrowheads indicate the position of the MTOC of the T cell. At least 40 T cells were analyzed in C–E. Data in C–E are summarized as means ± SEM from three (C and D) or two (E) independent experiments (error bars; *, P < 0.05; **, P < 0.01; ***, P < 0.001). Bar, 5 µm.
Figure 7.
Figure 7.
Glu-MTs are necessary for MTOC reorientation. (A and B) Glu-MT formation and MTOC distribution in Jurkat cells conjugated with latex beads coated with either anti-transferrin receptor (TfR) or anti-TCR antibodies in the presence or the absence of 2.5 µM PP2 (A). The histogram represents the percentage of T cells with Glu-MTs or with polarized MTOC (B). (C–E) Jurkat cells coexpressing GFP and shINF2b were transfected or not transfected with a DNA construct expressing the intact FH2 domain of INF2, as indicated. Cells were then conjugated to latex beads coated with either anti-TfR or anti-TCR antibodies and were stained for the expressed INF2 FH2 fragment and Glu-MT (C) or α-tubulin (D), as indicated. INF2-KD cells treated with 3 nM taxol for 18 h were activated with anti-TfR or anti-TCR–coated beads, and analyzed for MTOC reorientation by staining for α-tubulin (E). The histogram represents the percentage of T cells with Glu-MTs or polarized MTOC (E). Bars, 5 µm. The arrowheads indicate the position of the MTOC. At least 40 T cells were analyzed in B and E. Data in B and E are summarized as means ± SEM from three independent experiments (error bars; *, P < 0.05; **, P < 0.01; ***, P < 0.001).

Similar articles

Cited by

References

    1. Andrés-Delgado L., Antón O.M., Madrid R., Byrne J.A., Alonso M.A. 2010. Formin INF2 regulates MAL-mediated transport of Lck to the plasma membrane of human T lymphocytes. Blood. 116:5919–5929 10.1182/blood-2010-08-300665 - DOI - PubMed
    1. Baratt A., Arkhipov S.N., Maly I.V. 2008. An experimental and computational study of effects of microtubule stabilization on T-cell polarity. PLoS ONE. 3:e3861 10.1371/journal.pone.0003861 - DOI - PMC - PubMed
    1. Bartolini F., Gundersen G.G. 2010. Formins and microtubules. Biochim. Biophys. Acta. 1803:164–173 10.1016/j.bbamcr.2009.07.006 - DOI - PMC - PubMed
    1. Bartolini F., Moseley J.B., Schmoranzer J., Cassimeris L., Goode B.L., Gundersen G.G. 2008. The formin mDia2 stabilizes microtubules independently of its actin nucleation activity. J. Cell Biol. 181:523–536 10.1083/jcb.200709029 - DOI - PMC - PubMed
    1. Billadeau D.D., Nolz J.C., Gomez T.S. 2007. Regulation of T-cell activation by the cytoskeleton. Nat. Rev. Immunol. 7:131–143 10.1038/nri2021 - DOI - PubMed

Publication types

MeSH terms