

doi: 10.1038/nn.3218.
Epub 2012 Sep 16.
Reversible switching between epigenetic states in honeybee behavioral subcastes
Affiliations
- PMID: 22983211
- PMCID: PMC3518384
- DOI: 10.1038/nn.3218
Item in Clipboard
Reversible switching between epigenetic states in honeybee behavioral subcastes
Nat Neurosci.
2012 Oct.
Abstract
In honeybee societies, distinct caste phenotypes are created from the same genotype, suggesting a role for epigenetics in deriving these behaviorally different phenotypes. We found no differences in DNA methylation between irreversible worker and queen castes, but substantial differences between nurses and forager subcastes. Reverting foragers back to nurses reestablished methylation levels for a majority of genes and provides, to the best of our knowledge, the first evidence in any organism of reversible epigenetic changes associated with behavior.
Figures
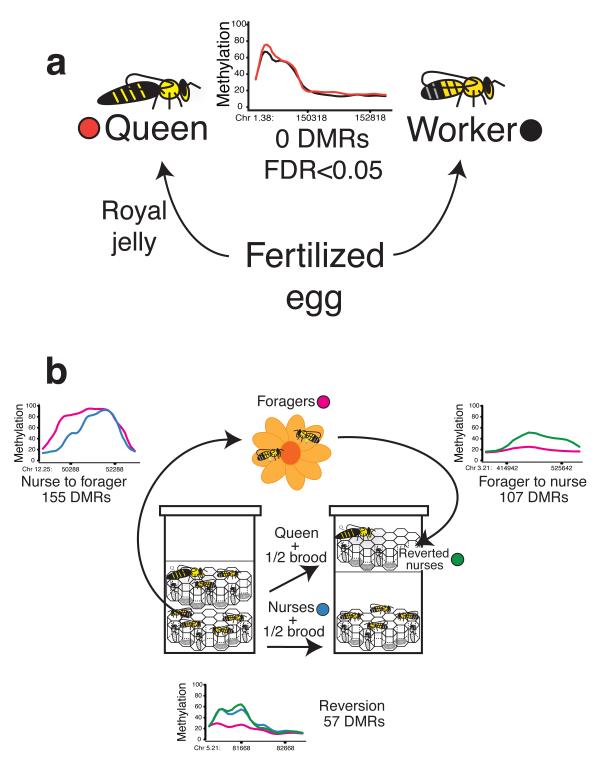
a, We compared newly emerged queens and workers using CHARM (n=5 per phenotype), and found no statistically significant differences. b, DNA methylation changes during nurse to forager transition and change back during forager to nurse transition (n=3 per phenotype). We found 155 DMRs associated with the nurse to forager transition, 107 DMRs associated with the forager to nurse transition, and 57 DMRs common to both lists that exhibit a nurse specific signature.
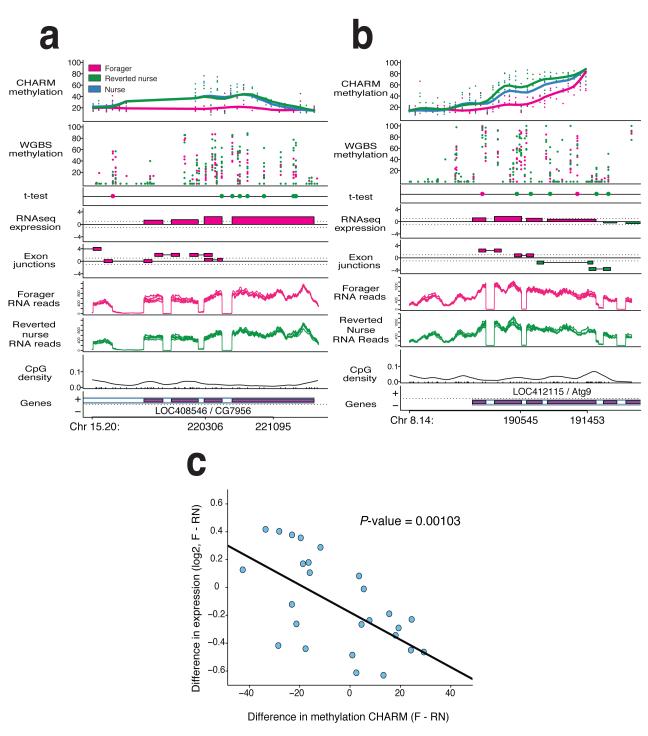
Two examples of CHARM DMRs. a-b, Top panels show percent methylation for both CHARM and WGBS data sets, with points representing individual samples, and the smoothed lines representing the average for the phenotype. The t-test panel displays the top 1% differentially methylated CpGs by t-test. Color of the point indicates which phenotype has greater methylation at that CpG (n=6 per phenotype). The RNAseq expression panel is a t-statistic based on the number or reads detected within the annotated exons, with the color indicating the higher expressed phenotype. The Exon junctions panel is a t-statistic based on the number or reads detected spanning the exon junctions, as predicted by the TopHat program, with the color indicating the higher expressed phenotype. Switching between higher expressed nurse and forager exon junctions is indicative of alternative splicing events. The RNA reads panels indicate the number of reads per phenotype as compiled by TopHat program (n=6 per phenotype). The bottom two panels show the CpG density, and the relative position of the gene. c. Plot of relative gene expression comparing foragers to reverted nurses. 26 genes associated with DMRs were tested for gene expression differences by real-time PCR (n=12 per phenotype). The plot depicts the difference in average log2 expression versus average difference in methylation as determined by CHARM. Correlation analysis results in a P-value of 0.001.
Comment in
-
Behavioural genetics: to bee or not to bee...a nurse.Nat Rev Neurosci. 2012 Nov;13(11):740. doi: 10.1038/nrn3363. Epub 2012 Oct 4. Nat Rev Neurosci. 2012. PMID: 23034479 No abstract available.
Similar articles
-
Gene expression and epigenetics reveal species-specific mechanisms acting upon common molecular pathways in the evolution of task division in bees.Sci Rep. 2021 Feb 11;11(1):3654. doi: 10.1038/s41598-020-75432-8. Sci Rep. 2021. PMID: 33574391 Free PMC article.
-
mRNA expression and DNA methylation in three key genes involved in caste differentiation in female honeybees (Apis mellifera).Dongwuxue Yanjiu. 2014 Mar;35(2):92-8. doi: 10.11813/j.issn.0254-5853.2014.2.092. Dongwuxue Yanjiu. 2014. PMID: 24668651 Free PMC article.
-
Making a queen: an epigenetic analysis of the robustness of the honeybee (Apis mellifera) queen developmental pathway.Mol Ecol. 2017 Mar;26(6):1598-1607. doi: 10.1111/mec.13990. Epub 2017 Feb 6. Mol Ecol. 2017. PMID: 28026884
-
Developmental epigenetic programming of caste-specific differences in social insects: an impact on longevity.Curr Aging Sci. 2014;7(3):176-86. doi: 10.2174/1874609807666141129173749. Curr Aging Sci. 2014. PMID: 25455698 Review.
-
Shifting behaviour: epigenetic reprogramming in eusocial insects.Curr Opin Cell Biol. 2012 Jun;24(3):367-73. doi: 10.1016/j.ceb.2012.02.005. Epub 2012 Mar 17. Curr Opin Cell Biol. 2012. PMID: 22429916 Review.
Cited by
-
Insects Provide Unique Systems to Investigate How Early-Life Experience Alters the Brain and Behavior.Front Behav Neurosci. 2021 Apr 21;15:660464. doi: 10.3389/fnbeh.2021.660464. eCollection 2021. Front Behav Neurosci. 2021. PMID: 33967715 Free PMC article. Review.
-
Transcriptomic and Epigenomic Dynamics of Honey Bees in Response to Lethal Viral Infection.Front Genet. 2020 Sep 24;11:566320. doi: 10.3389/fgene.2020.566320. eCollection 2020. Front Genet. 2020. PMID: 33101388 Free PMC article.
-
Changes of gene expression but not cytosine methylation are associated with male parental care reflecting behavioural state, social context and individual flexibility.J Exp Biol. 2019 Jan 16;222(Pt 2):jeb188649. doi: 10.1242/jeb.188649. J Exp Biol. 2019. PMID: 30446546 Free PMC article.
-
Genetic accommodation and the role of ancestral plasticity in the evolution of insect eusociality.J Exp Biol. 2018 Nov 26;221(Pt 23):jeb153163. doi: 10.1242/jeb.153163. J Exp Biol. 2018. PMID: 30478152 Free PMC article. Review.
-
A Role of Histone Acetylation in the Regulation of Circadian Rhythm in Ants.iScience. 2020 Feb 21;23(2):100846. doi: 10.1016/j.isci.2020.100846. Epub 2020 Jan 17. iScience. 2020. PMID: 32004990 Free PMC article.
References
Publication types
MeSH terms
Substances
Grants and funding
LinkOut - more resources
Full Text Sources
Molecular Biology Databases
