. 2012 Oct 26;48(2):169-81.
doi: 10.1016/j.molcel.2012.08.008. Epub 2012 Sep 13.

Genome-wide measurement of RNA folding energies

Affiliations

Genome-wide measurement of RNA folding energies

Yue Wan et al. Mol Cell. .

Abstract

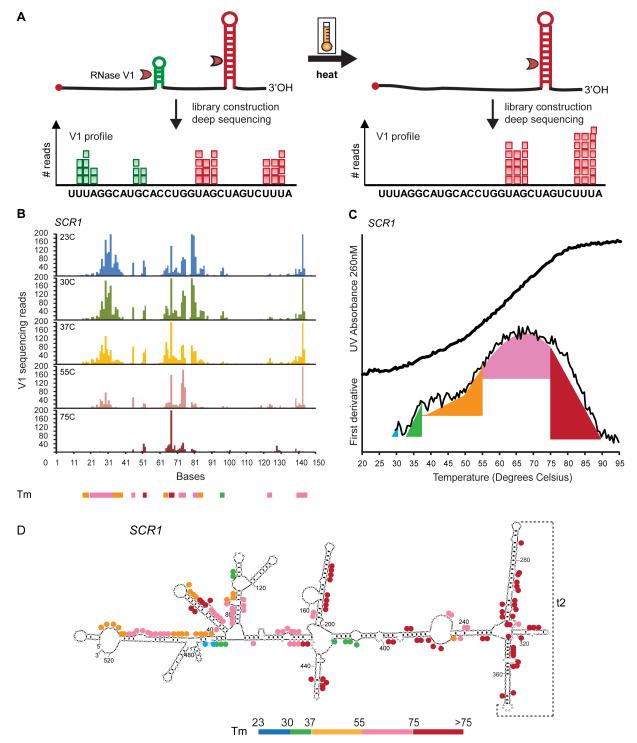
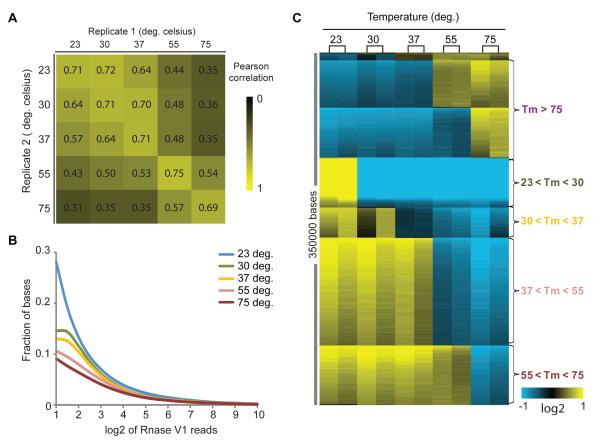
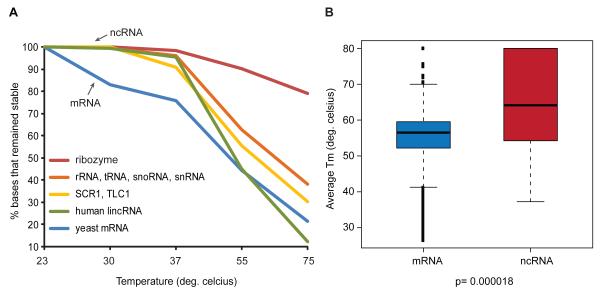
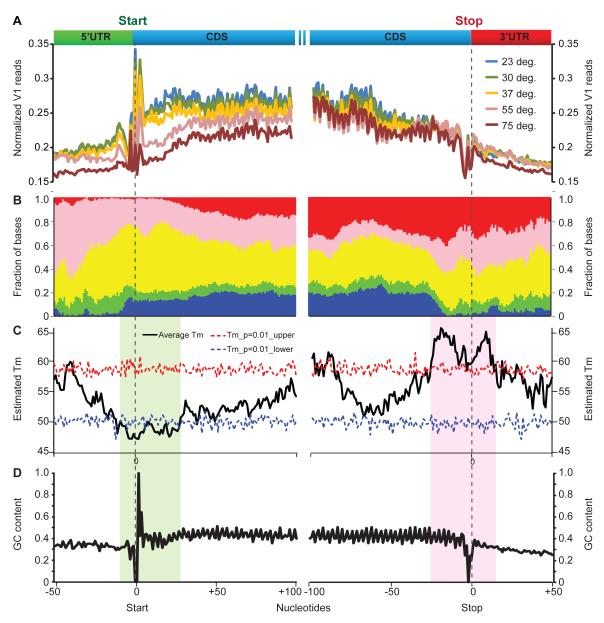
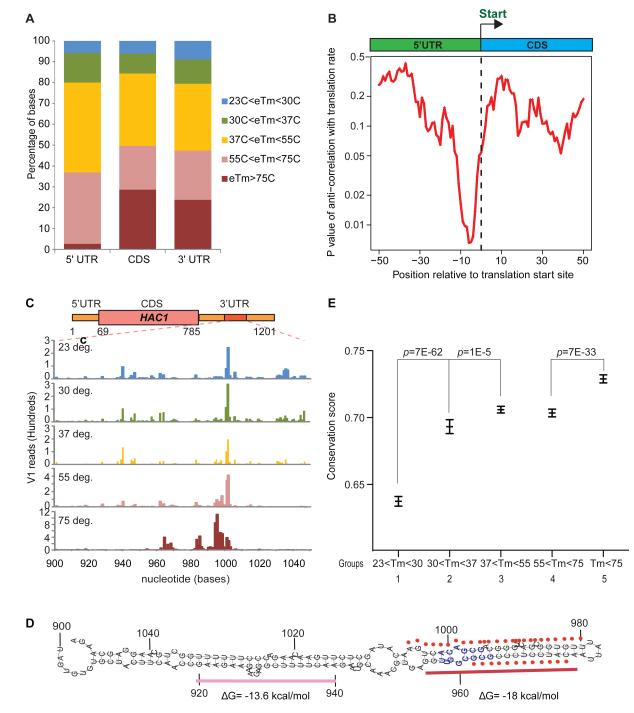
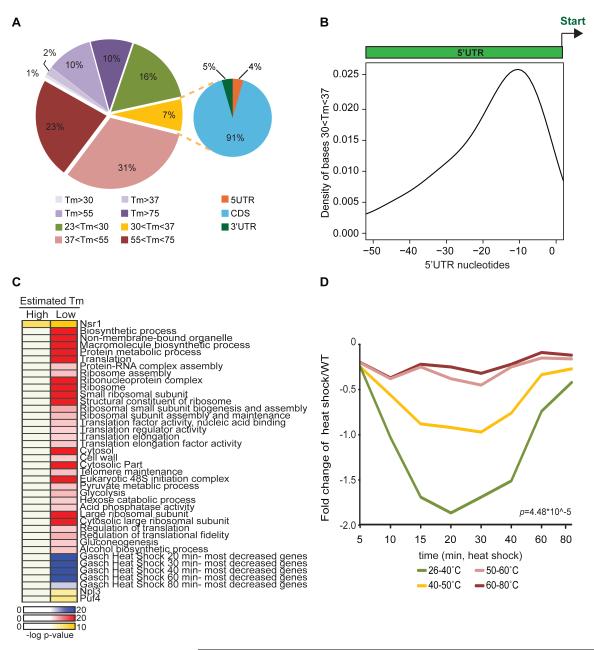
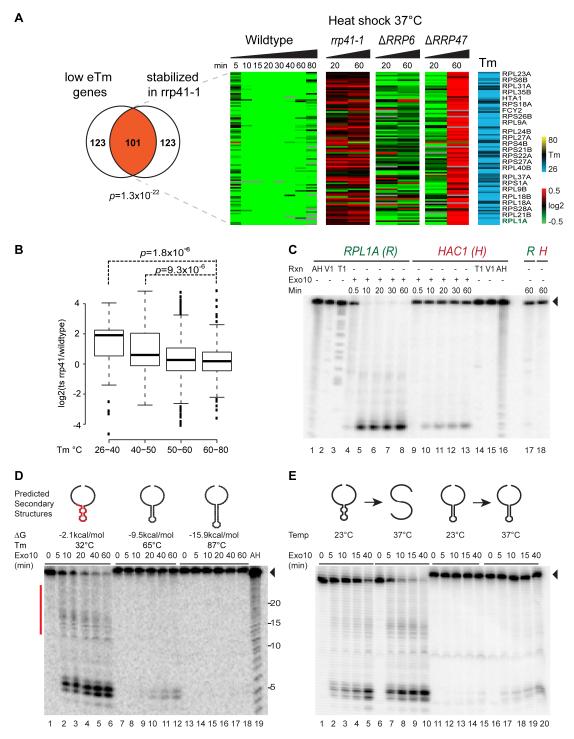
RNA structural transitions are important in the function and regulation of RNAs. Here, we reveal a layer of transcriptome organization in the form of RNA folding energies. By probing yeast RNA structures at different temperatures, we obtained relative melting temperatures (Tm) for RNA structures in over 4000 transcripts. Specific signatures of RNA Tm demarcated the polarity of mRNA open reading frames and highlighted numerous candidate regulatory RNA motifs in 3' untranslated regions. RNA Tm distinguished noncoding versus coding RNAs and identified mRNAs with distinct cellular functions. We identified thousands of putative RNA thermometers, and their presence is predictive of the pattern of RNA decay in vivo during heat shock. The exosome complex recognizes unpaired bases during heat shock to degrade these RNAs, coupling intrinsic structural stabilities to gene regulation. Thus, genome-wide structural dynamics of RNA can parse functional elements of the transcriptome and reveal diverse biological insights.


Figures

Figure 1
Figure 1. Measuring RNA melting temperatures by deep sequencing
A, Schematic of PARTE experiment. Differential melting of RNA secondary structures is read out by deep sequencing of RNA fragments generated by double-stranded specific RNase V1. Each aligned sequence provides double stranded structural information about a base (represented as a red or green square). A large number of reads aligned to a base indicates that the base was cleaved many times by RNase V1 and is hence more likely to be double-stranded. B, Raw RNase V1 sequencing reads for the first 150nt of the SCR1 RNA at 23, 30, 37, 55 and 75°C. Regions that melt at different temperatures were shown as colored bars at the bottom of the graph. The colored bar indicates the last temperature that the structure was found stable. C, UV absorbance of full length SCR1 RNA at 260nM, as well as first derivative of the UV absorbance over temperature, was obtained from 20-95°C . Nucleotide resolution melting transitions obtained by PARTE are indicated in color. D, RNA secondary structure of SCR1(Zwieb et al., 2005). A tertiary interaction is indicated as grey dotted lines. The melting transitions obtained from PARTE are indicated as colored dots.
Figure 2
Figure 2. PARTE identifies melting transitions at single nucleotide resolution
A, Pearson correlation of log2 of RNase V1 reads between biological replicates and samples of different temperatures. Biological replicates typically have the highest Pearson correlation (Pearson= 0.7). The greater the difference in temperature, the lower the Pearson correlation between two samples in their RNase V1 profile per base, which reflects the amount of pairing at that base. B, Distribution of RNase V1 cleavages with temperature. Bases with at least two RNase V1 reads at 23°C were analyzed for the distribution of RNase V1 reads with increasing temperature. In general, the percentage of bases with high V1 reads decreases with increasing temperature as more bases change from having V1 reads at 23°C, to having low or no V1 reads at higher temperatures, indicating melting of RNA structures at higher temperatures. C, Temperature transition per base is identified using Stepminer program(Sahoo et al., 2007). Each row indicates the temperature at which RNase V1 cleavages transit from low to high or high to low reads. The two columns in each of the five temperatures are biological replicates. Blue indicates two fold decrease from the mean of normalized RNase V1 reads, and yellow indicates two fold increase from the mean of normalized RNase V1 reads.
Figure 3
Figure 3. Different classes of RNAs can be classified according to their propensity to melt
A, The bases with confidently called Tms are separated into different classes of RNAs, which include coding, non-coding RNAs in the yeast transcriptome, human lincRNAs (fragments of HOTAIR and HOTTIP) and ribozymes (P4P6 and P9-9.2 domains of the Tetrahymena ribozyme). As shown in the graphs, mRNAs melt at lower temperatures than ncRNAs that often have structural roles. B, The estimated Tm of a gene was calculated as the average of all the Tm of the bases that belong to that gene. ncRNAs (red box) are significantly more thermo-stable than yeast mRNAs (blue box).
Figure 4
Figure 4. The energetic landscape of messenger RNAs
A, Normalized V1 reads were averaged across all mRNA transcripts that have at least 200 bases in their coding region and aligned by their start and stop codons (dotted brown lines). B, The relative abundance of bases with different Tms around the start (left) and stop (left) codon. The total number of Tm values at each position is normalized to 1. C, Average Tm profiles across 5′UTR, coding region and 3′UTR. The -3 to +3nt region upstream of the start codon has the lowest average Tm, while the 20nt upstream and 10nt downstream of the stop codon has the highest Tm. The locations of the Tm values are randomized for 100 times along the gene body to obtain the null distributions of estimated Tms, which was used to calculate the P values. The dashed lines indicate the significance level of p=0.01 (red: 1% chance of obtaining the observed or higher estimated Tm; blue: 1% chance of obtaining the observed or lower estimated Tm). The black line indicates the estimated Tm averaged across all the yeast genes for that particular base that is surrounding the translation start site (left) and the translation stop site (right). D, The average GC content around the translation start site (left) and the translation stop site (right).
Figure 5
Figure 5. The energetic landscape of UTRs
A, Distribution of Tm in 5′UTR, coding region and 3′UTR. 5′UTRs have much less stable structures than coding regions or 3′UTRs. B, Thermal stability near the translation start codon is anti-correlated with translation rate. This small but significant anti-correlation of Tm over 23°C and the translation rat e is centered on 10 bases upstream of the translation start site (R=0.11, p=0.007). C, High structural stability identifies RNA regulatory elements. The most stable element within 3′ UTRs of yeast is nucleotides 900 to 1050 of Hac1 mRNA; V1 reads are shown across the 5 temperatures. While many bases have RNase V1 cleavages at 23°C, only the region between 950 to 1100 nucleotides gained V1 reads at 75°C. D, Predicted secondary structure of nucleotides 900-1050 of Hac1 mRNA. Bases with Tm> 75°C (red dots) are precisely the same region (blue bases) required for Hac1 mRNA localization to the ER membrane during heat shock(Aragon et al., 2009). Although bases 955-975 and bases 920-940 are both double-stranded duplexes, the duplex 920-940 melted at lower temperatures than 955-975 as shown in part d. G for both duplexes were calculated (Dinamelt) and shown. E, Bases in high Tm structures are more conserved. An 11 nt moving window average of phastCons7way (7 yeast Multiz Alignment) for yeast (sacCer2 assembly) is calculated. For each population of bases (58772, 25721, 109324, 79496, and 66753 bases that melt by 30, 37, 55, 75 and >75C respectively) the mean and SEM were plotted using Prism program. More thermo-stable bases are significantly more conserved than meltable bases. We chose bases in CDS to eliminate biases that could occur due to more melting in the 5′UTRs.
Figure 6
Figure 6. Functional annotations of genes with low estimated melting temperatures
A, Distribution of bases that melt between 30 to 37°C are among 5′UTR, CDS and 3′UTR. Left: Distribution of melting temperatures in mRNA bases. Right: Distribution of bases that melt between 30-37°C. B, Bases that melt between 30-37°C in the 5′UTR are found most densely around ribosomal entry site (between -10 and -20nt upstream of start codon). Tms are estimated by Stepminer. C, Enrichment of genes encoded by mRNAs with high or low melting temperatures in Gene Ontology (GO) terms (shown in red), interaction with specific RNA binding proteins (RBP, yellow), or regulation during heat shock (blue)(Gasch et al., 2000; Hogan et al., 2008). Genes are classified into the top or bottom ten percentile according to their melting temperatures. Significance in overlap with gene sets is calculated using hypergeometric test (FDR<0.05). mRNAs with low melting temperatures are significantly enriched for ribosomal components, in translation, bind to RBPs, as well as decrease greatly in abundance during heat shock. D, RNA folding energies predicts the pattern of RNA decay in vivo during heat shock. mRNAs were categorized according to their Tm. For each category, the median of their gene expression response to heat shock, along the time course, is plotted. Genes that fall into the different categories show significant differences in their response to heat shock (p=4.48 × 10⁻⁵, ANOVA single factor analysis); genes with the lowest Tm show a most severe and sustained decrease during heat shock.
Figure 7
Figure 7. RNA structure stabilities influence RNA decay by exosome complex
A, Exosome is required for selective heat-induced decay of low eTm transcripts. Left: Overlap of low eTm mRNAs and mRNAs stabilized genes in exosome rrp41-1 mutant (p=1.3×10⁻²² , hypergeometric test). Right: Gene expression pattern of low Tm mRNAs during heat shock in WT vs. mutant yeast. Each row is a gene, and each column indicates relative changes in transcript levels after heat shock as compared to WT yeast at room temperature. A low eTm mRNA, RPL1A (green), was randomly selected for biochemical studies in panel C. B, Boxplot of genes in different eTm groups show that low eTm genes tend to be more stabilized in rrp41-1 mutant at 20min, 37°C. Stabilization is calculated by subtracting the log2 of gene expression change in WT yeast from log2 of gene expression change in rrp41-1 yeast. C, Exosome reads endogenous RNA thermometers. Ten subunit exosome complex (Exo10) selectively degrades a 150mer fragment of RPL1A (Tm of gene= 29°C) over a 150mer fragment of HAC1 (Tm of gene= 62°C). Full length substrate (black arrowhead). RNA treatment with alkaline hydrolysis (AH, lanes 1,16), RNase V1 (Lanes 2, 15) and RNase T1 in 8M urea (Lanes 3, 14) are shown. RNA substrates were stable in the absence of Exo10 for 60min at 37°C (lanes 17, 18). D, RNA secondary structure blocks exosome processing. Exo-10 reaction with designer substrates with increased pairing stability [44mer substrate(Dziembowski et al., 2007), 44mut2, 44mut4]; substrate Tms were measured by UV spectrometry. The red bar indicates the residues that Exo10 partially stops at and are mapped to the stem loop (red) in the predicted secondary structure of the 44mer RNA. E, Recapituation of heat-induced RNA decay by the exosome. Exo10 (2nM) was incubated with 100nM of 44mer RNA or 44mut2 RNA subtrate at 37°C. The 44mer substrate functions as a RNA thermometer; its unpairing at 37°C facilitates decay by Exo10. In contrast, mutations that raise the Tm in 44mut2 render it non-degradable by Exo10 at 37°C.

Comment in

Similar articles

Cited by

References

    1. Aragon T, van Anken E, Pincus D, Serafimova IM, Korennykh AV, Rubio CA, Walter P. Messenger RNA targeting to endoplasmic reticulum stress signalling sites. Nature. 2009;457:736–740. - PMC - PubMed
    1. Badis G, Saveanu C, Fromont-Racine M, Jacquier A. Targeted mRNA degradation by deadenylation-independent decapping. Mol. Cell. 2004;15:5–15. - PubMed
    1. Bonneau F, Basquin J, Ebert J, Lorentzen E, Conti E. The yeast exosome functions as a macromolecular cage to channel RNA substrates for degradation. Cell. 2009;139:547–559. - PubMed
    1. Breaker RR. Riboswitches and the RNA World. Cold Spring Harb Perspect. Biol. 2010 - PMC - PubMed
    1. Brown JT, Johnson AW. A cis-acting element known to block 3′ mRNA degradation enhances expression of polyA-minus mRNA in wild-type yeast cells and phenocopies a ski mutant. RNA. 2001;7:1566–1577. - PMC - PubMed

Publication types

Associated data