. 2013 Jan;20(1):169-80.
doi: 10.1038/cdd.2012.121. Epub 2012 Sep 14.

EphA/ephrin-A signaling is critically involved in region-specific apoptosis during early brain development

Affiliations

EphA/ephrin-A signaling is critically involved in region-specific apoptosis during early brain development

E Park et al. Cell Death Differ. 2013 Jan.

Abstract

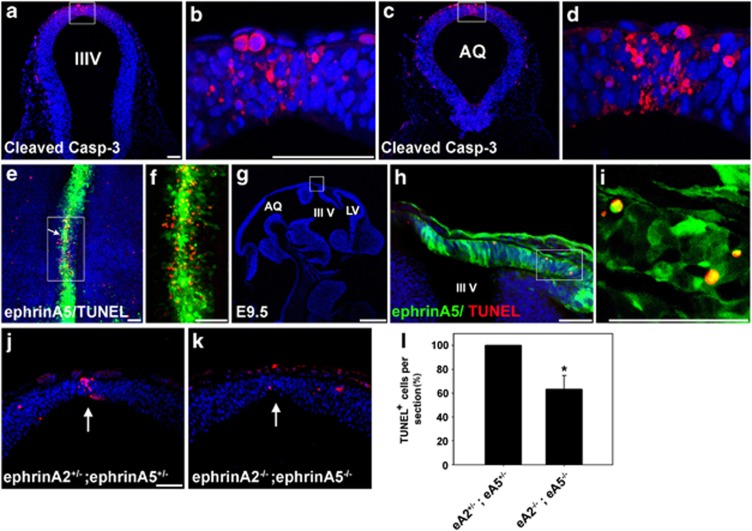
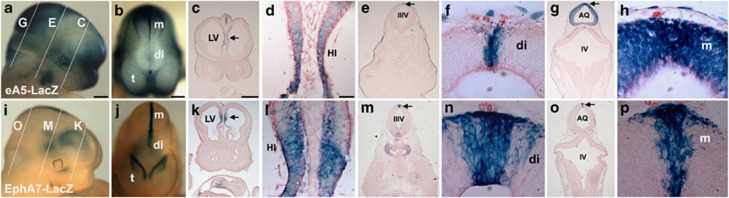
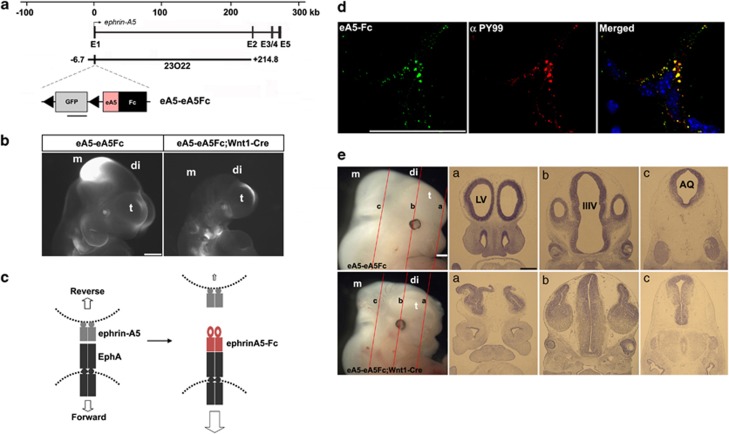
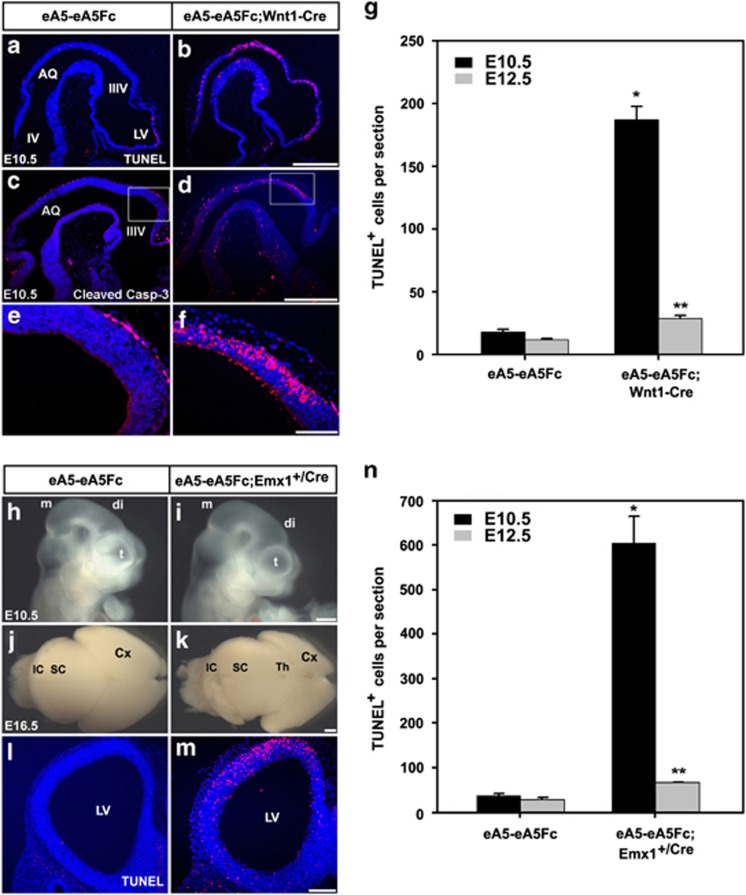
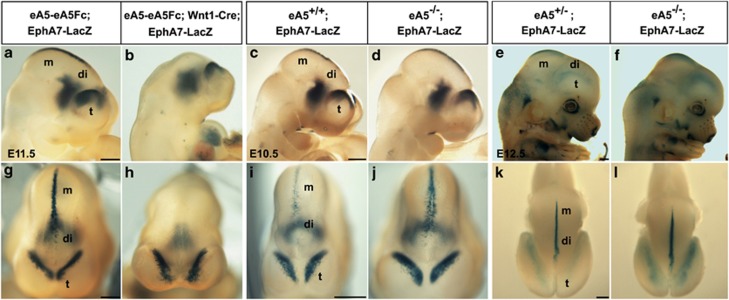
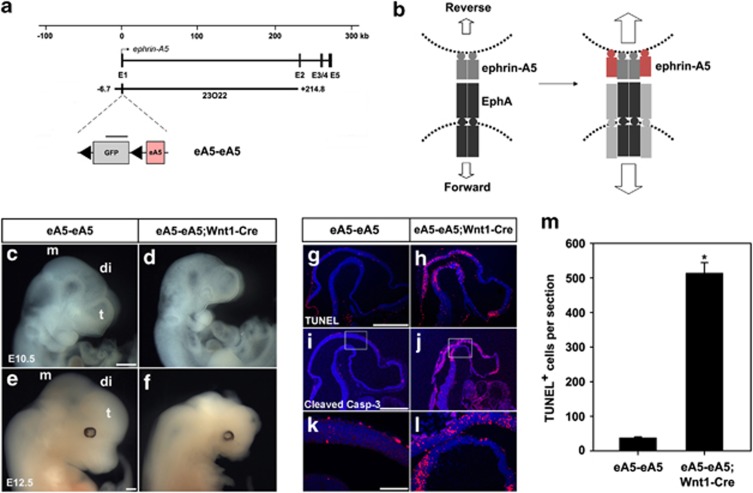
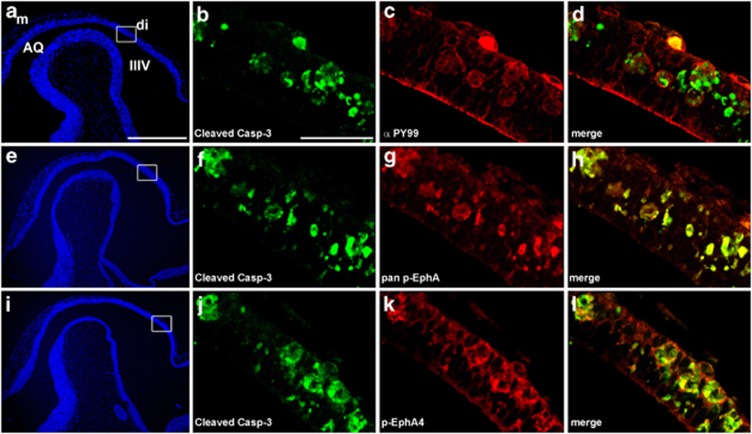
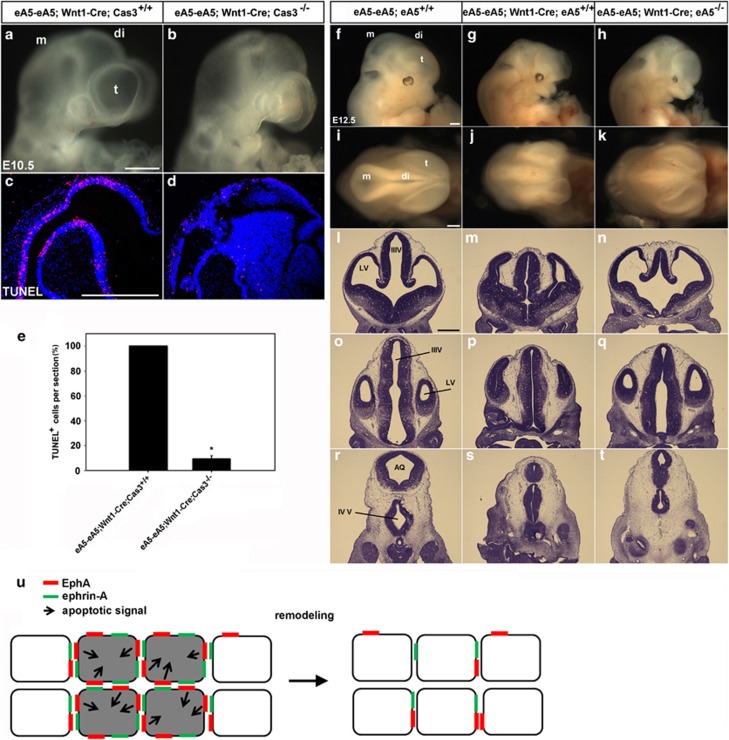
EphAs and ephrin-As have been implicated in the morphogenesis of the developing brain. We found that EphA7 and ephrin-A5 are coexpressed in the dorsal midline (DM) of the diencephalon and anterior mesencephalon. Interestingly, programmed cell death (PCD) of the neural epithelial cells normally found in this region was reduced in ephrin-A5/ephrin-A2 dual-deficient embryos. In contrast, in vivo expression of ephrin-A5-Fc or full-length ephrin-A5 strongly induced apoptosis in neural epithelial cells and was accompanied by severe brain malformation during embryonic development. Expression of ephrinA5-Fc correlated with apoptosis of EphA7-expressing cells, whereas null mutation of ephrin-A5 resulted in the converse phenotype. Importantly, null mutation of caspase-3 or endogenous ephrin-A5 attenuated the PCD induced by ectopically overexpressed ephrin-A5. Together, our results suggest that brain region-specific PCD may occur in a region where EphAs cluster with neighboring ephrin-As through cell-cell contact.


Figures

Figure 1
Figure 1
PCD is observed in the DM of the diencephalon and anterior mesencephalon. (a and c) Transverse sections of an E9.5 embryo stained with anti-activated caspase-3 antibody. (b and d) Higher magnification photographs of the DM region in (a) and (c), respectively. IIIV, third ventricle; AQ, cerebral aqueduct. (e) Whole-mount TUNEL staining of DM explants of the diencephalon and anterior mesencephalon. An explant was dissected out of the E9.5 embryo of the ephrinA5-GFP BAC transgenic line. This embryo expresses GFP under the ephrin-A5 promoter as described previously. The arrow shows the region between the diencephalon and mesencephalon. (f) High-magnification photograph of the region marked by the box in (e). (g) Sagittal section of an E11.5 embryo from the ephrin-A5-GFP BAC transgenic line. Frozen sections were further subjected to TUNEL staining followed by DAPI staining. LV, lateral ventricle. Anterior is toward the right. (h) High-magnification photograph of the DM region corresponding to the box in (g). (i) High-magnification photograph of the region corresponding to the box in (h). (j and k) Coronal sections of E9.5 littermate embryos of the indicated genotype were stained with the TUNEL assay. The embryos were generated by crossing heterozygous ephrin-A2+/− and heterozygous ephrin-A5+/− mice. (l) The data in (j) and (k) were quantified by counting the number of TUNEL-positive cells in each coronal section. Data represent the mean±S.E. for six independent experiments in which a pair of littermate embryos with similar brain sizes was used for serial 5 μm sections (eA2−/−;eA5−/− (n=6), eA2+/−;eA5+/− (n=6)). Twenty sections surrounding the mesencephalic and diencephalic boundary were counted for each experiment. Only TUNEL-positive cells present in the DM were counted and normalized to the number of sections. The number of TUNEL-positive cells in a double heterozygous embryo for ephrin-A2 and ephrin-A5 was considered ‘100% apoptosis' in each experimental set. *P<0.001. Scale bars=50 μm (a, b, e, f, h, i, and j) and 500 μm (g)
Figure 2
Figure 2
Coexpression of EphA7 and ephrin-A5 in the DM of the diencephalon and anterior mesencephalon. Whole-mount X-gal staining was performed using E11.5 mouse embryos. (a and b) Lateral and dorsal views, respectively, of the ephrin-A5 BAC transgenic embryo. (c, e, and g) Coronal sections corresponding to the lines in (a). (d, f, and h) High-magnification photographs of the regions indicated by the arrows in (c), (e), and (g), respectively. (i and j) Lateral and dorsal views, respectively, of the EphA7 BAC transgenic embryo. (k, m, and o) Coronal sections corresponding to the lines in (i). (l, n, and p) High-magnification photographs of the regions indicated by the arrows in (k), (m), and (o), respectively. di, diencephalon; m, mesencephalon; HI, hippocampus; LV, lateral ventricle; IIIV, third ventricle; AQ, cerebral aqueduct; IV, fourth ventricle. Scale bars=500 μm (ac) and 50 μm (d)
Figure 3
Figure 3
Severe brain malformation in mouse embryos expressing ephrin-A5-Fc. (a) Schematic map of the ephrin-A5 genomic locus with the ephrin-A5 BAC clone (RP23-23O22). The modified ephrin-A5 BAC clone, eA5-eA5Fc, is identical to the original ephrin-A5 BAC clone, except that it contains a floxed GFP followed by an ephrin-A5-Fc expression cassette inserted upstream into the translation start codon in the first exon of ephrin-A5. (b) GFP fluorescent image of the indicated transgenic embryo at E10.5. GFP images were compared after littermate embryos were obtained from crossing eA5-eA5Fc BAC transgenic mice with Wnt1-Cre mice. Three different transgenic lines were generated with the same result. (c) Schematic diagram showing that soluble ephrin-A5-Fc is secreted from ephrin-A5-expressing cells and that they bind to and activate EphA receptors in the neighboring NECs. (d) In vitro-dissociated NECs were cultured and treated with soluble ephrin-A5-Fc (unclustered) for 30 min at 37°C. Cells were fixed and immunostained using anti-phosphotyrosine antibody (αPY99) and anti-human IgG conjugated to Alexa488. (e) Comparison of E12.5 littermate embryos from a cross between eA5-eA5Fc BAC transgenic mice and Wnt1-Cre mice. Similar results were consistently observed in three different transgenic lines when each line was mated with Wnt1-Cre mice. (a–c) Coronal sections corresponding to each line shown in E12.5 embryos were stained using cresyl violet. t, telencephalon; di, diencephalon; m, mesencephalon; LV, lateral ventricle; IIIV, third ventricle; AQ, cerebral aqueduct. Scale bars=500 μm (b, e) and 50 μm (d)
Figure 4
Figure 4
Increased apoptosis in mouse embryos expressing ephrin-A5-Fc. To compare cell death in the cephalic region of E10.5 embryos according to genotype, sagittal sections were stained with the TUNEL assay (a and b) or anti-activated caspase-3 antibody (c and d). (e, f) High magnification of the dorsal diencephalic region corresponding to the boxes in (c) and (d), respectively. (g) The data in (a) and (b) were quantified by counting the number of TUNEL-positive cells in each sagittal section. Similar experiments were performed using E12.5 littermate embryos for quantitation (data not shown). Data represent the mean±S.E. of five independent experiments in which eight serial sections (5 μm) flanking the DM were counted for each condition. Only TUNEL-positive cells in the dorsal part of the mesencephalic and diencephalic regions were counted. *P<0.001; **P<0.01. (hn) Littermate embryos from crossing eA5-eA5Fc BAC transgenic mice with Emx1+/Cre mice were analyzed with TUNEL staining. Lateral view of an E10.5 embryo (h and i) and dorsal view of an E16.5 embryonic brain (j and k). Note that the size of the cortical region was much smaller in the compound transgenic line expressing ephrin-A5-Fc in cortical progenitors. (l and m) Coronal sections of E10.5 embryos of the indicated genotype were stained with the TUNEL assay for comparison of cell death in the telencephalic region. (n) Experiments were performed essentially as described in (g) of this figure. Data represent the mean±S.E. for at least five independent experiments with eight sections counted for each condition. *P<0.001; **P<0.01. Scale bars=500 μm (b, d, i, and k) and 100 μm (f and m)
Figure 5
Figure 5
The number of EphA7-expressing cells in the DM was inversely correlated with the expression level of ephrin-A5. Whole-mount X-gal staining was performed with littermate embryos with the indicated genotype obtained from each mating described below. (a and b) Lateral views of E11.5 embryos (n=6) from a cross between the eA5-eA5Fc;EphA7-LacZ transgenic line and the Wnt1-Cre transgenic line. (cf) Lateral views of E10.5 (c and d) or E12.5 embryos (e and f) from a cross between eA5+/−;EphA7-LacZ mice and eA5+/− mice (eA5+/+;EphA7-LacZ at E10.5 (n=6), eA5−/−;EphA7-LacZ at E10.5 (n=8), eA5+/+;EphA7-LacZ at E12.5 (n=5), and eA5−/−;EphA7-LacZ at E12.5 (n=7)). (gl) Dorsal views of the embryos shown in the top panels. t, telencephalon; di, diencephalon; m, mesencephalon. Scale bar=500 μm
Figure 6
Figure 6
Severe brain malformation and enhanced apoptosis are observed in mouse embryos overexpressing full-length ephrin-A5. (a) Experiments were performed essentially as described for Figure 3a, except that full-length human ephrin-A5 cDNA was used instead of ephrin-A5-Fc. (b) Schematic diagram showing that human ephrin-A5 is expressed in mouse cells that endogenously express ephrin-A5 and that their membrane tethering subsequently elicits bidirectional signaling between two apposing NECs. (cf) Littermate embryos at the indicated developmental stages were obtained from crossing eA5-eA5 BAC transgenic mice with Wnt1-Cre mice. Note that severe malformation of the cephalic region was evident in embryos overexpressing ephrin-A5 under control of Wnt1-Cre. The same results were observed in three different lines. (gl) Apoptotic analysis using the embryos shown in (c) and (d), respectively. Sagittal sections were stained with the TUNEL assay (g and h) or anti-activated caspase-3 antibody (i and j) for comparison of cell death. (k and l) High magnification of the brain regions corresponding to the boxes in (i) and (j), respectively. (m) The data in (g) and (h) were quantified by counting the number of TUNEL-positive cells in each sagittal section as described in Figure 4g. Data represent the mean±S.E. for five independent experiments with eight sections (5 μm) counted for each condition. *P<0.001. t, telencephalon; di, diencephalon; m, mesencephalon; LV, lateral ventricle; IIIV, third ventricle; AQ, cerebral aqueduct. Scale bars=500 μm (c, e, g, and i) and 100 μm (k)
Figure 7
Figure 7
EphA receptors are strongly tyrosine phosphorylated in mouse embryos overexpressing full-length ephrin-A5. Sagittal sections were prepared from E10.5 embryos overexpressing ephrin-A5 under the control of Wnt1-Cre, and then stained with anti-activated caspase-3 antibody (green) and anti-pTyr antibody (ad), anti-pan p-EphA antibody (eh), or anti-p-EphA4 antibody (il). Note that the apoptotic cells stained with anti-activated caspase-3 show irregular cell morphology and a high level of tyrosine-phosphorylated EphA receptors. Scale bars=500 μm (a) and 50 μm (b)
Figure 8
Figure 8
Partial rescue of ephrin-A5-induced apoptosis and the brain defect by null mutation of caspase-3 or ephrin-A5. (a and b) E10.5 littermate embryos were obtained from crossing eA5-eA5;Cas3+/− mice with Wnt1-Cre;Cas3+/− mice. (c and d) TUNEL staining of sagittal sections from the embryos shown in (a) and (b), respectively. (e) Experiments were performed essentially as described in Figure 4g. Data represent the mean±S.E. for five independent experiments with 15 sections counted for each condition (eA5-eA5;Wnt1-Cre;Cas3+/+ at E10.5 (n=5), eA5-eA5;Wnt1-Cre;Cas3−/− at E10.5 (n=5)). *P<0.001. (fh) Littermate embryos with the indicated genotype were obtained from crossing eA5-eA5Fc;eA5+/− mice with Wnt1-Cre;eA5+/− mice (eA5-eA5;Wnt1-Cre;ephrin-A5−/− (n=5)). (ik) Dorsal views of the embryos shown in (f), (g), and (h), respectively. (lt) Coronal sections corresponding to each line in (ik) were stained with cresyl violet. (u) Model in which ephrin-A transduces apoptotic signaling into EphA-expressing cells at the site of cell–cell contact. Apoptotic signaling may be intense in a brain region where the coexpressed EphA and ephrin-A proteins segregate into distinct domains in the same cell, but they are also mainly engaged in trans-interactions through cell–cell contact. In this model, we hypothesize that the activated EphA receptors may interact with the apoptotic signaling cascade and that this cross-talk may occur in a specific brain region such as DM neural epithelial tissue coexpressing EphAs and ephrin-As. As a result, some NECs (represented by the gray color in this diagram) would be eliminated from this region, which may be a basis for the neuroepithelial tissue remodeling that occurs during early brain development. Scale bar=500 μm

Similar articles

Cited by

References

    1. Homma S, Yaginuma H, Oppenheim RW. Programmed cell death during the earliest stages of spinal cord development in the chick embryo: a possible means of early phenotypic selection. J Comp Neurol. 1994;345:377–395. - PubMed
    1. de la Rosa EJ, de Pablo F. Cell death in early neural development: beyond the neurotrophic theory. Trends Neurosci. 2000;23:454–458. - PubMed
    1. Kuan CY, Roth KA, Flavell RA, Rakic P. Mechanisms of programmed cell death in the developing brain. Trends Neurosci. 2000;23:291–297. - PubMed
    1. Yeo W, Gautier J. Early neural cell death: dying to become neurons. Dev Biol. 2004;274:233–244. - PubMed
    1. Buss RR, Sun W, Oppenheim RW. Adaptive roles of programmed cell death during nervous system development. Annu Rev Neurosci. 2006;29:1–35. - PubMed

Publication types

MeSH terms