The transcriptional landscape and mutational profile of lung adenocarcinoma
- PMID: 22975805
- PMCID: PMC3483540
- DOI: 10.1101/gr.145144.112
The transcriptional landscape and mutational profile of lung adenocarcinoma
Abstract
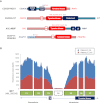
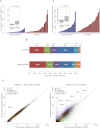
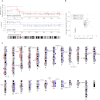
All cancers harbor molecular alterations in their genomes. The transcriptional consequences of these somatic mutations have not yet been comprehensively explored in lung cancer. Here we present the first large scale RNA sequencing study of lung adenocarcinoma, demonstrating its power to identify somatic point mutations as well as transcriptional variants such as gene fusions, alternative splicing events, and expression outliers. Our results reveal the genetic basis of 200 lung adenocarcinomas in Koreans including deep characterization of 87 surgical specimens by transcriptome sequencing. We identified driver somatic mutations in cancer genes including EGFR, KRAS, NRAS, BRAF, PIK3CA, MET, and CTNNB1. Candidates for novel driver mutations were also identified in genes newly implicated in lung adenocarcinoma such as LMTK2, ARID1A, NOTCH2, and SMARCA4. We found 45 fusion genes, eight of which were chimeric tyrosine kinases involving ALK, RET, ROS1, FGFR2, AXL, and PDGFRA. Among 17 recurrent alternative splicing events, we identified exon 14 skipping in the proto-oncogene MET as highly likely to be a cancer driver. The number of somatic mutations and expression outliers varied markedly between individual cancers and was strongly correlated with smoking history of patients. We identified genomic blocks within which gene expression levels were consistently increased or decreased that could be explained by copy number alterations in samples. We also found an association between lymph node metastasis and somatic mutations in TP53. These findings broaden our understanding of lung adenocarcinoma and may also lead to new diagnostic and therapeutic approaches.
Figures


Similar articles
-
Molecular diagnostic characteristics based on the next generation sequencing in lung cancer and its relationship with the expression of PD-L1.Pathol Res Pract. 2020 Feb;216(2):152797. doi: 10.1016/j.prp.2019.152797. Epub 2019 Dec 23. Pathol Res Pract. 2020. PMID: 31926773
-
Systematic identification of cancer-related long noncoding RNAs and aberrant alternative splicing of quintuple-negative lung adenocarcinoma through RNA-Seq.Lung Cancer. 2017 Jul;109:21-27. doi: 10.1016/j.lungcan.2017.04.009. Epub 2017 Apr 21. Lung Cancer. 2017. PMID: 28577945
-
Frequency of well-identified oncogenic driver mutations in lung adenocarcinoma of smokers varies with histological subtypes and graduated smoking dose.Lung Cancer. 2013 Jan;79(1):8-13. doi: 10.1016/j.lungcan.2012.09.018. Epub 2012 Oct 23. Lung Cancer. 2013. PMID: 23098378
-
Management of advanced non-small cell lung cancers with known mutations or rearrangements: latest evidence and treatment approaches.Ther Adv Respir Dis. 2016 Apr;10(2):113-29. doi: 10.1177/1753465815617871. Epub 2015 Nov 30. Ther Adv Respir Dis. 2016. PMID: 26620497 Free PMC article. Review.
-
Treatment of lung adenocarcinoma by molecular-targeted therapy and immunotherapy.Surg Today. 2018 Jan;48(1):1-8. doi: 10.1007/s00595-017-1497-7. Epub 2017 Mar 9. Surg Today. 2018. PMID: 28280984 Review.
Cited by
-
Downregulated CDH3 is correlated with a better prognosis for LUAD and decreases proliferation and migration of lung cancer cells.Genes Genomics. 2024 Jun;46(6):713-731. doi: 10.1007/s13258-023-01476-5. Epub 2023 Dec 8. Genes Genomics. 2024. PMID: 38064156
-
The prognostic value of EGFR overexpression and amplification in Esophageal squamous cell Carcinoma.BMC Cancer. 2015 May 8;15:377. doi: 10.1186/s12885-015-1393-8. BMC Cancer. 2015. PMID: 25953424 Free PMC article.
-
An empirical likelihood ratio test robust to individual heterogeneity for differential expression analysis of RNA-seq.Brief Bioinform. 2018 Jan 1;19(1):109-117. doi: 10.1093/bib/bbw103. Brief Bioinform. 2018. PMID: 27769992 Free PMC article.
-
Molecular diagnostic alterations in squamous cell carcinoma of the head and neck and potential diagnostic applications.Eur Arch Otorhinolaryngol. 2014 Feb;271(2):211-23. doi: 10.1007/s00405-013-2400-9. Epub 2013 Mar 7. Eur Arch Otorhinolaryngol. 2014. PMID: 23467835 Review.
-
Response to MET inhibitors in patients with stage IV lung adenocarcinomas harboring MET mutations causing exon 14 skipping.Cancer Discov. 2015 Aug;5(8):842-9. doi: 10.1158/2159-8290.CD-14-1467. Epub 2015 May 13. Cancer Discov. 2015. PMID: 25971939 Free PMC article.
References
-
- Alberti L, Carniti C, Miranda C, Roccato E, Pierotti MA 2003. RET and NTRK1 proto-oncogenes in human diseases. J Cell Physiol 195: 168–186 - PubMed
Publication types
MeSH terms
LinkOut - more resources
Full Text Sources
Other Literature Sources
Medical
Molecular Biology Databases
Research Materials
Miscellaneous
