Msh2 acts in medium-spiny striatal neurons as an enhancer of CAG instability and mutant huntingtin phenotypes in Huntington's disease knock-in mice
- PMID: 22970194
- PMCID: PMC3436885
- DOI: 10.1371/journal.pone.0044273
Msh2 acts in medium-spiny striatal neurons as an enhancer of CAG instability and mutant huntingtin phenotypes in Huntington's disease knock-in mice
Abstract
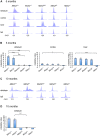
The CAG trinucleotide repeat mutation in the Huntington's disease gene (HTT) exhibits age-dependent tissue-specific expansion that correlates with disease onset in patients, implicating somatic expansion as a disease modifier and potential therapeutic target. Somatic HTT CAG expansion is critically dependent on proteins in the mismatch repair (MMR) pathway. To gain further insight into mechanisms of somatic expansion and the relationship of somatic expansion to the disease process in selectively vulnerable MSNs we have crossed HTT CAG knock-in mice (HdhQ111) with mice carrying a conditional (floxed) Msh2 allele and D9-Cre transgenic mice, in which Cre recombinase is expressed specifically in MSNs within the striatum. Deletion of Msh2 in MSNs eliminated Msh2 protein in those neurons. We demonstrate that MSN-specific deletion of Msh2 was sufficient to eliminate the vast majority of striatal HTT CAG expansions in HdhQ111 mice. Furthermore, MSN-specific deletion of Msh2 modified two mutant huntingtin phenotypes: the early nuclear localization of diffusely immunostaining mutant huntingtin was slowed; and the later development of intranuclear huntingtin inclusions was dramatically inhibited. Therefore, Msh2 acts within MSNs as a genetic enhancer both of somatic HTT CAG expansions and of HTT CAG-dependent phenotypes in mice. These data suggest that the selective vulnerability of MSNs may be at least in part contributed by the propensity for somatic expansion in these neurons, and imply that intervening in the expansion process is likely to have therapeutic benefit.
Conflict of interest statement
Figures


Similar articles
-
Mismatch repair genes Mlh1 and Mlh3 modify CAG instability in Huntington's disease mice: genome-wide and candidate approaches.PLoS Genet. 2013 Oct;9(10):e1003930. doi: 10.1371/journal.pgen.1003930. Epub 2013 Oct 31. PLoS Genet. 2013. PMID: 24204323 Free PMC article.
-
A CAG repeat threshold for therapeutics targeting somatic instability in Huntington's disease.Brain. 2024 May 3;147(5):1784-1798. doi: 10.1093/brain/awae063. Brain. 2024. PMID: 38387080 Free PMC article.
-
Full length mutant huntingtin is required for altered Ca2+ signaling and apoptosis of striatal neurons in the YAC mouse model of Huntington's disease.Neurobiol Dis. 2008 Jul;31(1):80-8. doi: 10.1016/j.nbd.2008.03.010. Epub 2008 Apr 16. Neurobiol Dis. 2008. PMID: 18502655 Free PMC article.
-
Non-Cell Autonomous and Epigenetic Mechanisms of Huntington's Disease.Int J Mol Sci. 2021 Nov 19;22(22):12499. doi: 10.3390/ijms222212499. Int J Mol Sci. 2021. PMID: 34830381 Free PMC article. Review.
-
The selective vulnerability of nerve cells in Huntington's disease.Neuropathol Appl Neurobiol. 2001 Feb;27(1):1-21. doi: 10.1046/j.0305-1846.2001.00299.x. Neuropathol Appl Neurobiol. 2001. PMID: 11298997 Review.
Cited by
-
The Repeat Expansion Diseases: The dark side of DNA repair.DNA Repair (Amst). 2015 Aug;32:96-105. doi: 10.1016/j.dnarep.2015.04.019. Epub 2015 Apr 30. DNA Repair (Amst). 2015. PMID: 26002199 Free PMC article. Review.
-
Cell-type-specific CAG repeat expansions and toxicity of mutant Huntingtin in human striatum and cerebellum.Nat Genet. 2024 Mar;56(3):383-394. doi: 10.1038/s41588-024-01653-6. Epub 2024 Jan 30. Nat Genet. 2024. PMID: 38291334 Free PMC article.
-
GAA•TTC repeat expansion in human cells is mediated by mismatch repair complex MutLγ and depends upon the endonuclease domain in MLH3 isoform one.Nucleic Acids Res. 2018 May 4;46(8):4022-4032. doi: 10.1093/nar/gky143. Nucleic Acids Res. 2018. PMID: 29529236 Free PMC article.
-
Base editing strategies to convert CAG to CAA diminish the disease-causing mutation in Huntington's disease.Elife. 2024 Jun 13;12:RP89782. doi: 10.7554/eLife.89782. Elife. 2024. PMID: 38869243 Free PMC article.
-
Dysregulation of DNA repair genes in Fuchs endothelial corneal dystrophy.Exp Eye Res. 2023 Jun;231:109499. doi: 10.1016/j.exer.2023.109499. Epub 2023 May 9. Exp Eye Res. 2023. PMID: 37169279 Free PMC article.
References
-
- Huntington’s disease collaborative research group (1993) A novel gene containing a trinucleotide repeat that is expanded and unstable on Huntington’s disease chromosomes. Cell 72: 971–983. - PubMed
-
- Vonsattel JP, Myers RH, Stevens TJ, Ferrante RJ, Bird ED, et al. (1985) Neuropathological classification of Huntington’s disease. J Neuropath Exp Neurol 44: 559–577. - PubMed
-
- Rosas HD, Koroshetz WJ, Chen YI, Skeuse C, Vangel M, et al. (2003) Evidence for more widespread cerebral pathology in early HD: an MRI-based morphometric analysis. Neurology 60: 1615–1620. - PubMed
Publication types
MeSH terms
Substances
Grants and funding
LinkOut - more resources
Full Text Sources
Other Literature Sources
Medical
Molecular Biology Databases
Research Materials
Miscellaneous

