Biochemical and pharmacological characterization of human α/β-hydrolase domain containing 6 (ABHD6) and 12 (ABHD12)
- PMID: 22969151
- PMCID: PMC3466009
- DOI: 10.1194/jlr.M030411
Biochemical and pharmacological characterization of human α/β-hydrolase domain containing 6 (ABHD6) and 12 (ABHD12)
Abstract
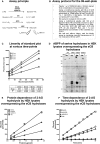
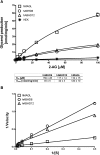
In the central nervous system, three enzymes belonging to the serine hydrolase family are thought to regulate the life time of the endocannabinoid 2-arachidonoylglycerol (C20:4) (2-AG). From these, monoacylglycerol lipase (MAGL) is well characterized and, on a quantitative basis, is the main 2-AG hydrolase. The postgenomic proteins α/β-hydrolase domain containing (ABHD)6 and ABHD12 remain poorly characterized. By applying a sensitive fluorescent glycerol assay, we delineate the substrate preferences of human ABHD6 and ABHD12 in comparison with MAGL. We show that the three hydrolases are genuine MAG lipases; medium-chain saturated MAGs were the best substrates for hABHD6 and hMAGL, whereas hABHD12 preferred the 1 (3)- and 2-isomers of arachidonoylglycerol. Site-directed mutagenesis of the amino acid residues forming the postulated catalytic triad (ABHD6: S148-D278-H306, ABHD12: S246-D333-H372) abolished enzymatic activity as well as labeling with the active site serine-directed fluorophosphonate probe TAMRA-FP. However, the role of D278 and H306 as residues of the catalytic core of ABHD6 could not be verified because none of the mutants showed detectable expression. Inhibitor profiling revealed striking potency differences between hABHD6 and hABHD12, a finding that, when combined with the substrate profiling data, should facilitate further efforts toward the design of potent and selective inhibitors, especially those targeting hABHD12, which currently lacks such inhibitors.
Figures


Similar articles
-
Robust hydrolysis of prostaglandin glycerol esters by human monoacylglycerol lipase (MAGL).Mol Pharmacol. 2014 Nov;86(5):522-35. doi: 10.1124/mol.114.094284. Epub 2014 Aug 19. Mol Pharmacol. 2014. PMID: 25140003
-
A Sensitive and Versatile Fluorescent Activity Assay for ABHD12.Methods Mol Biol. 2016;1412:179-89. doi: 10.1007/978-1-4939-3539-0_19. Methods Mol Biol. 2016. PMID: 27245904
-
Therapeutic potential of targeting α/β-Hydrolase domain-containing 6 (ABHD6).Eur J Med Chem. 2020 Jul 15;198:112353. doi: 10.1016/j.ejmech.2020.112353. Epub 2020 Apr 25. Eur J Med Chem. 2020. PMID: 32371333 Review.
-
Biochemical and pharmacological characterization of the human lymphocyte antigen B-associated transcript 5 (BAT5/ABHD16A).PLoS One. 2014 Oct 7;9(10):e109869. doi: 10.1371/journal.pone.0109869. eCollection 2014. PLoS One. 2014. PMID: 25290914 Free PMC article.
-
The serine hydrolases MAGL, ABHD6 and ABHD12 as guardians of 2-arachidonoylglycerol signalling through cannabinoid receptors.Acta Physiol (Oxf). 2012 Feb;204(2):267-76. doi: 10.1111/j.1748-1716.2011.02280.x. Epub 2011 Apr 22. Acta Physiol (Oxf). 2012. PMID: 21418147 Free PMC article. Review.
Cited by
-
Inhibiting degradation of 2-arachidonoylglycerol as a therapeutic strategy for neurodegenerative diseases.Pharmacol Ther. 2023 Apr;244:108394. doi: 10.1016/j.pharmthera.2023.108394. Epub 2023 Mar 24. Pharmacol Ther. 2023. PMID: 36966972 Free PMC article. Review.
-
Role of the Endocannabinoid System in the Regulation of Intestinal Homeostasis.Cell Mol Gastroenterol Hepatol. 2022;14(4):947-963. doi: 10.1016/j.jcmgh.2022.05.015. Epub 2022 Jun 22. Cell Mol Gastroenterol Hepatol. 2022. PMID: 35750314 Free PMC article. Review.
-
PharmacoSTORM nanoscale pharmacology reveals cariprazine binding on Islands of Calleja granule cells.Nat Commun. 2021 Nov 11;12(1):6505. doi: 10.1038/s41467-021-26757-z. Nat Commun. 2021. PMID: 34764251 Free PMC article.
-
In vivo metabolite profiling as a means to identify uncharacterized lipase function: recent success stories within the alpha beta hydrolase domain (ABHD) enzyme family.Biochim Biophys Acta. 2014 Aug;1841(8):1097-101. doi: 10.1016/j.bbalip.2014.01.004. Epub 2014 Jan 12. Biochim Biophys Acta. 2014. PMID: 24423940 Free PMC article. Review.
-
Sequence analysis and structure prediction of ABHD16A and the roles of the ABHD family members in human disease.Open Biol. 2018 May;8(5):180017. doi: 10.1098/rsob.180017. Open Biol. 2018. PMID: 29794032 Free PMC article. Review.
References
-
- Bisogno T., Howell F., Williams G., Minassi A., Cascio M. G., Ligresti A., Matias I., Schiano-Moriello A., Paul P., Williams E. J., et al. 2003. Cloning of the first sn1-DAG lipases points to the spatial and temporal regulation of endocannabinoid signaling in the brain. J. Cell Biol. 163: 463–468 - PMC - PubMed
-
- Piomelli D. 2003. The molecular logic of endocannabinoid signalling. Nat. Rev. Neurosci. 4: 873–884 - PubMed
-
- Di Marzo V., Bisogno T., De Petrocellis L. 2007. Endocannabinoids and related compounds: walking back and forth between plant natural products and animal physiology. Chem. Biol. 14: 741–756 - PubMed
Publication types
MeSH terms
Substances
LinkOut - more resources
Full Text Sources
Other Literature Sources
Molecular Biology Databases
Research Materials

