. 2013 Aug 1;32(31):3648-54.
doi: 10.1038/onc.2012.398. Epub 2012 Sep 10.

miRNA let-7c promotes granulocytic differentiation in acute myeloid leukemia

Affiliations

miRNA let-7c promotes granulocytic differentiation in acute myeloid leukemia

A Pelosi et al. Oncogene. .

Abstract

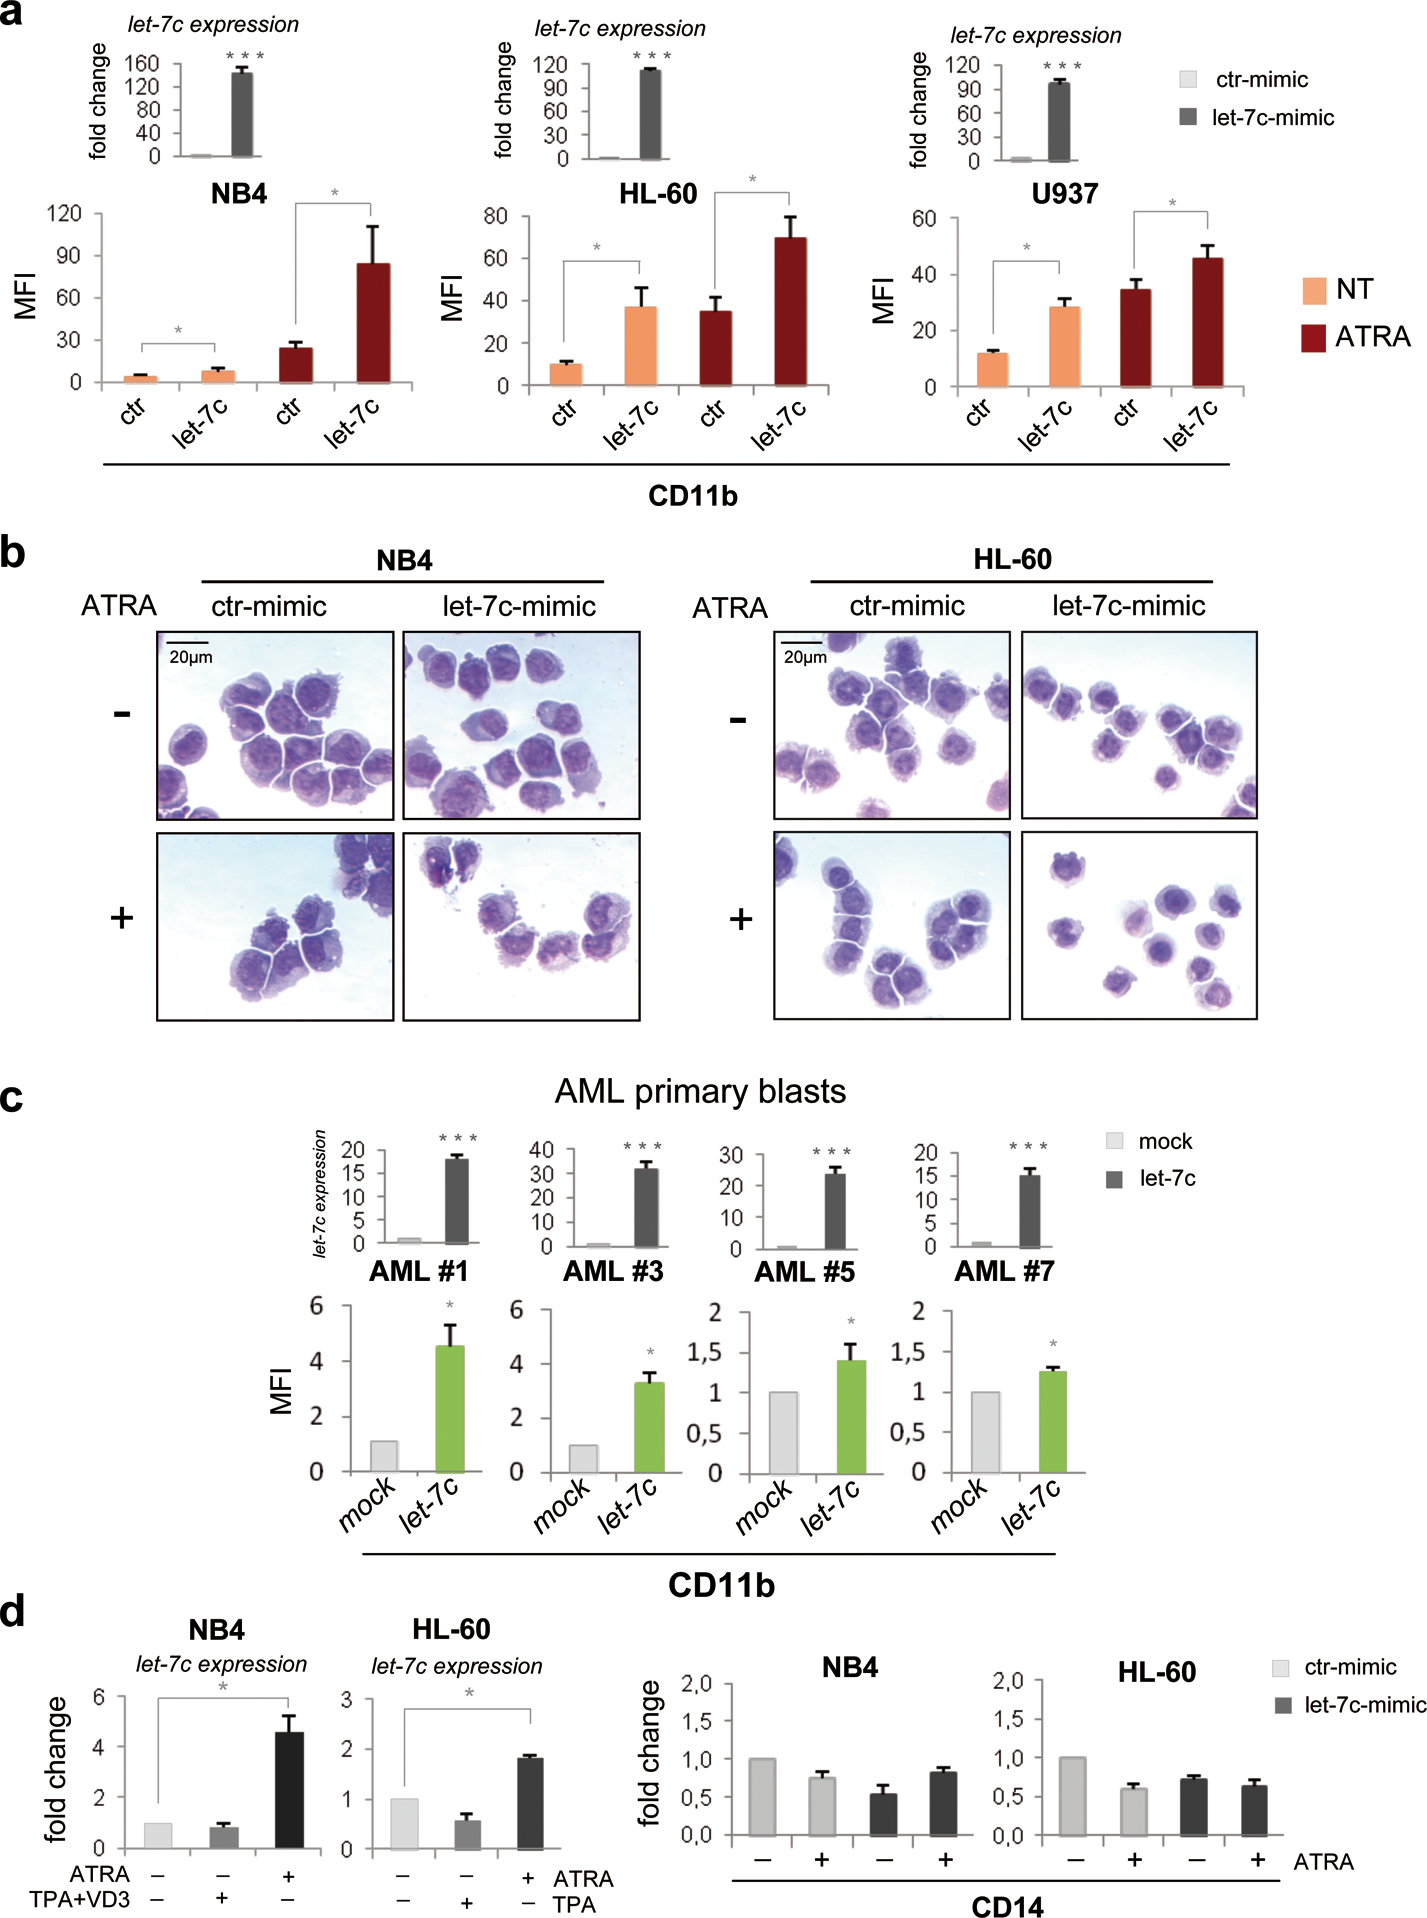
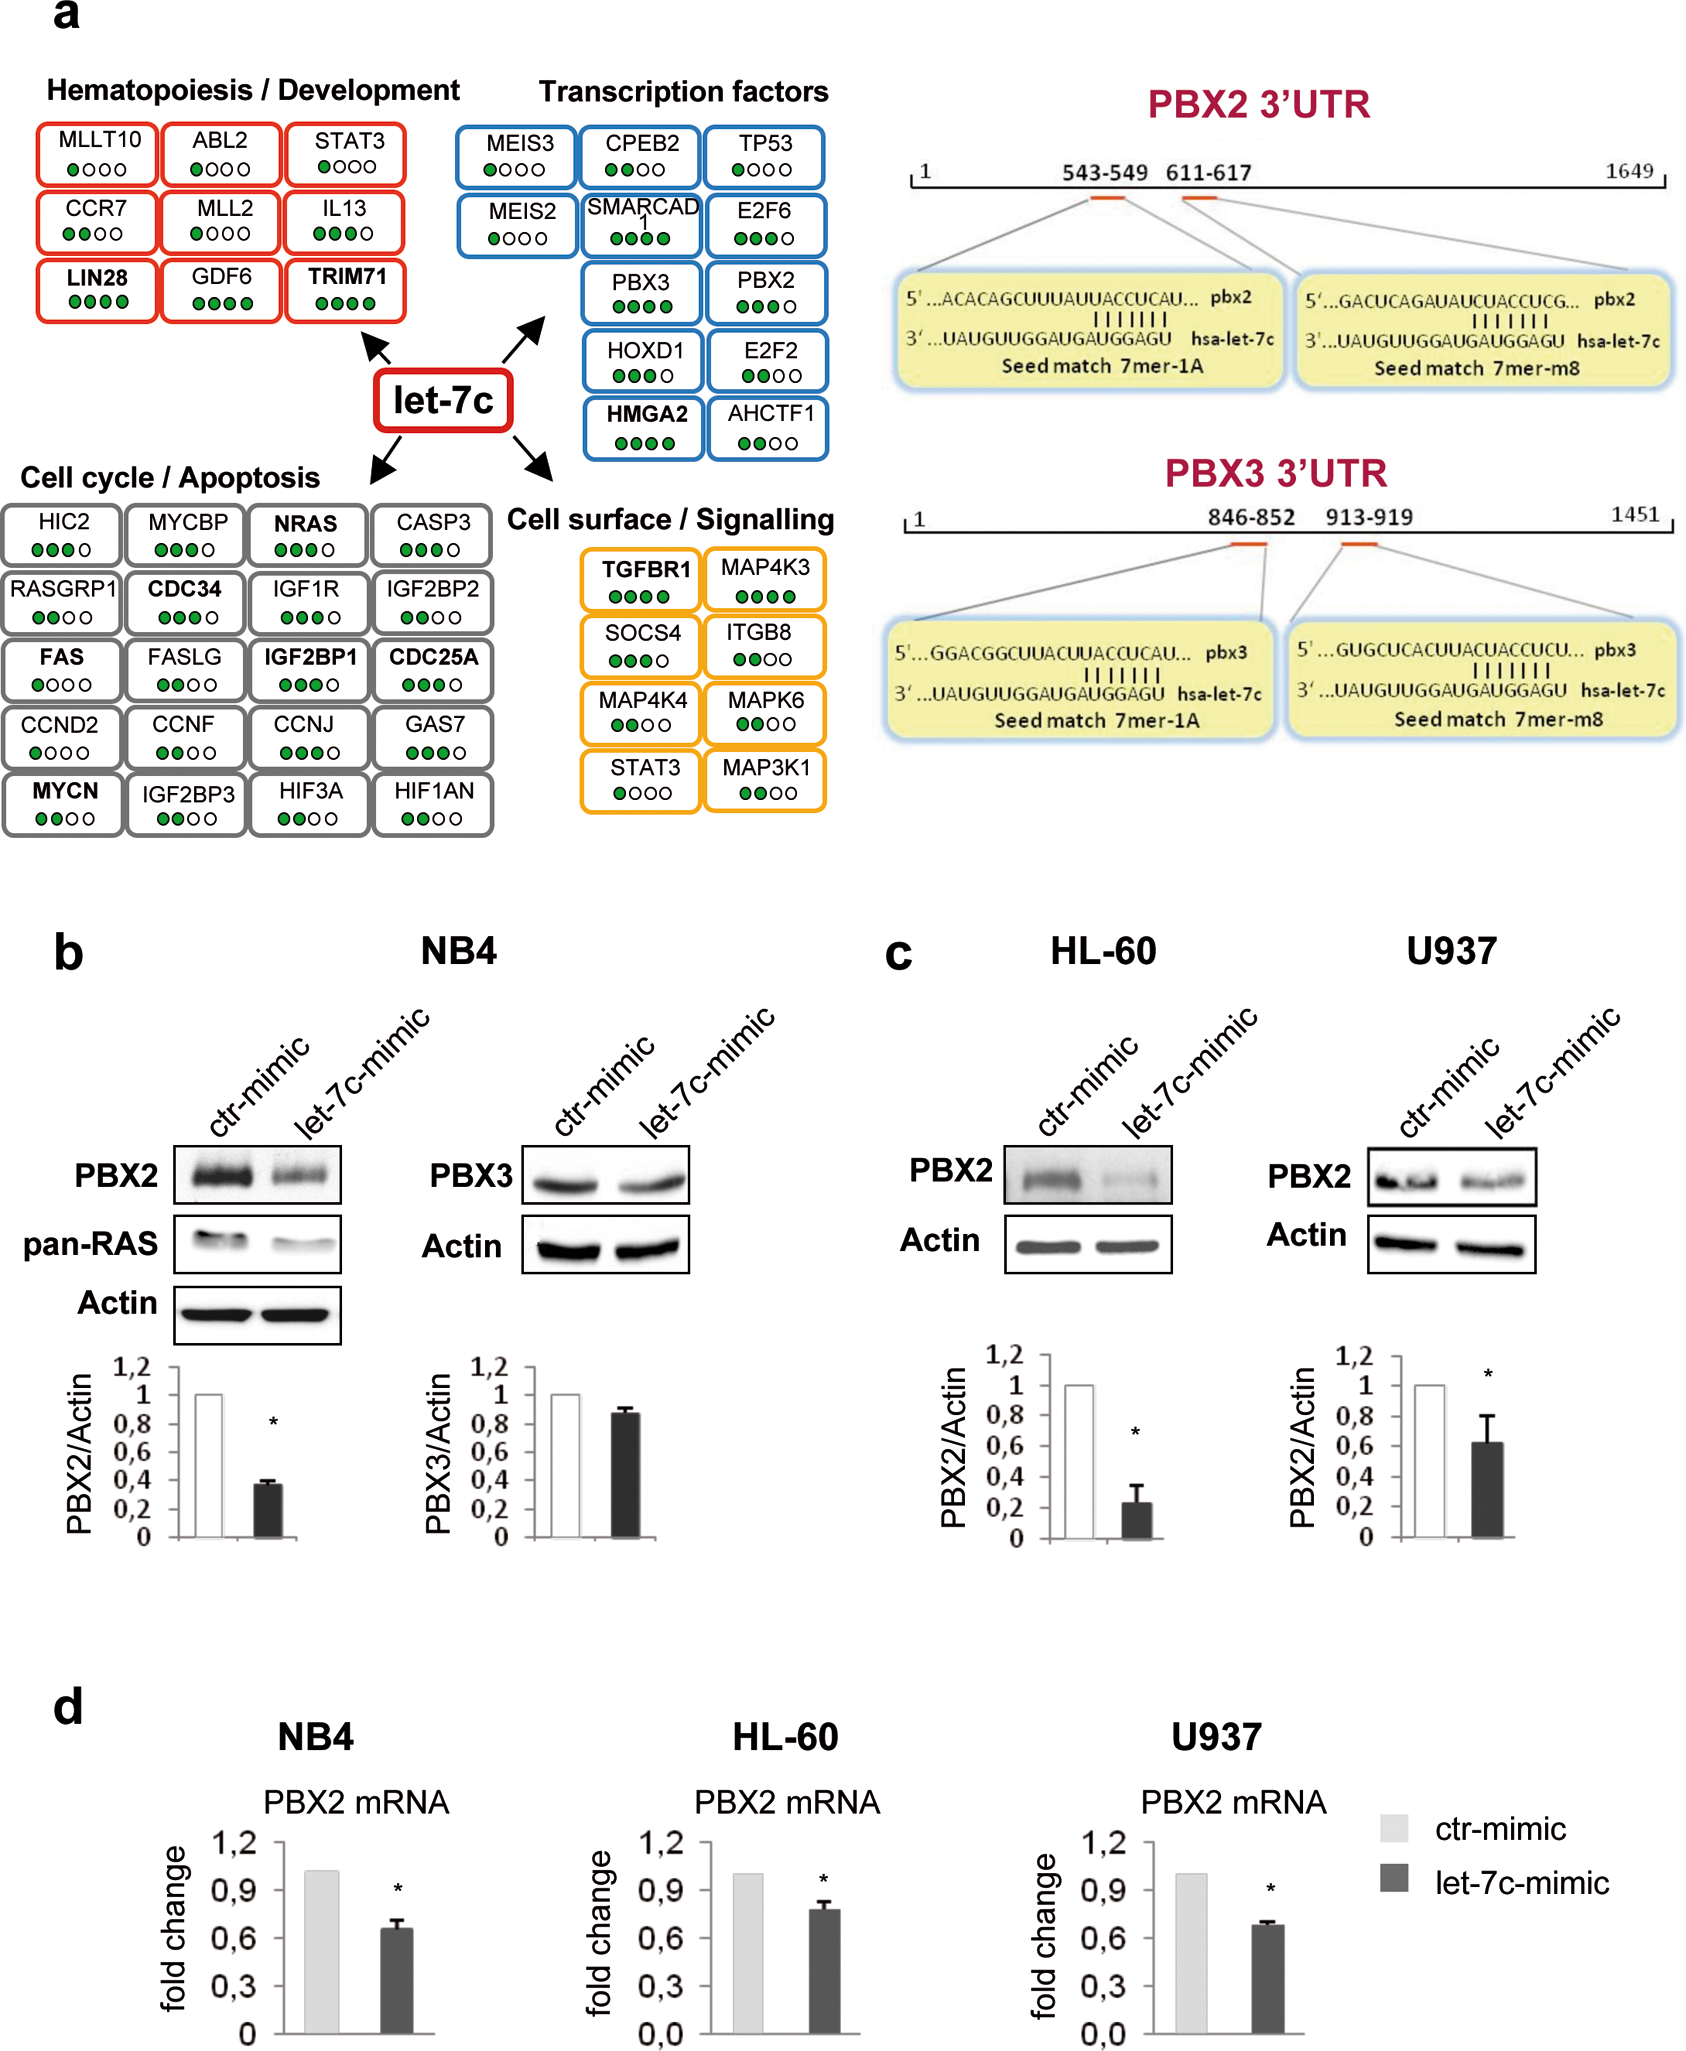
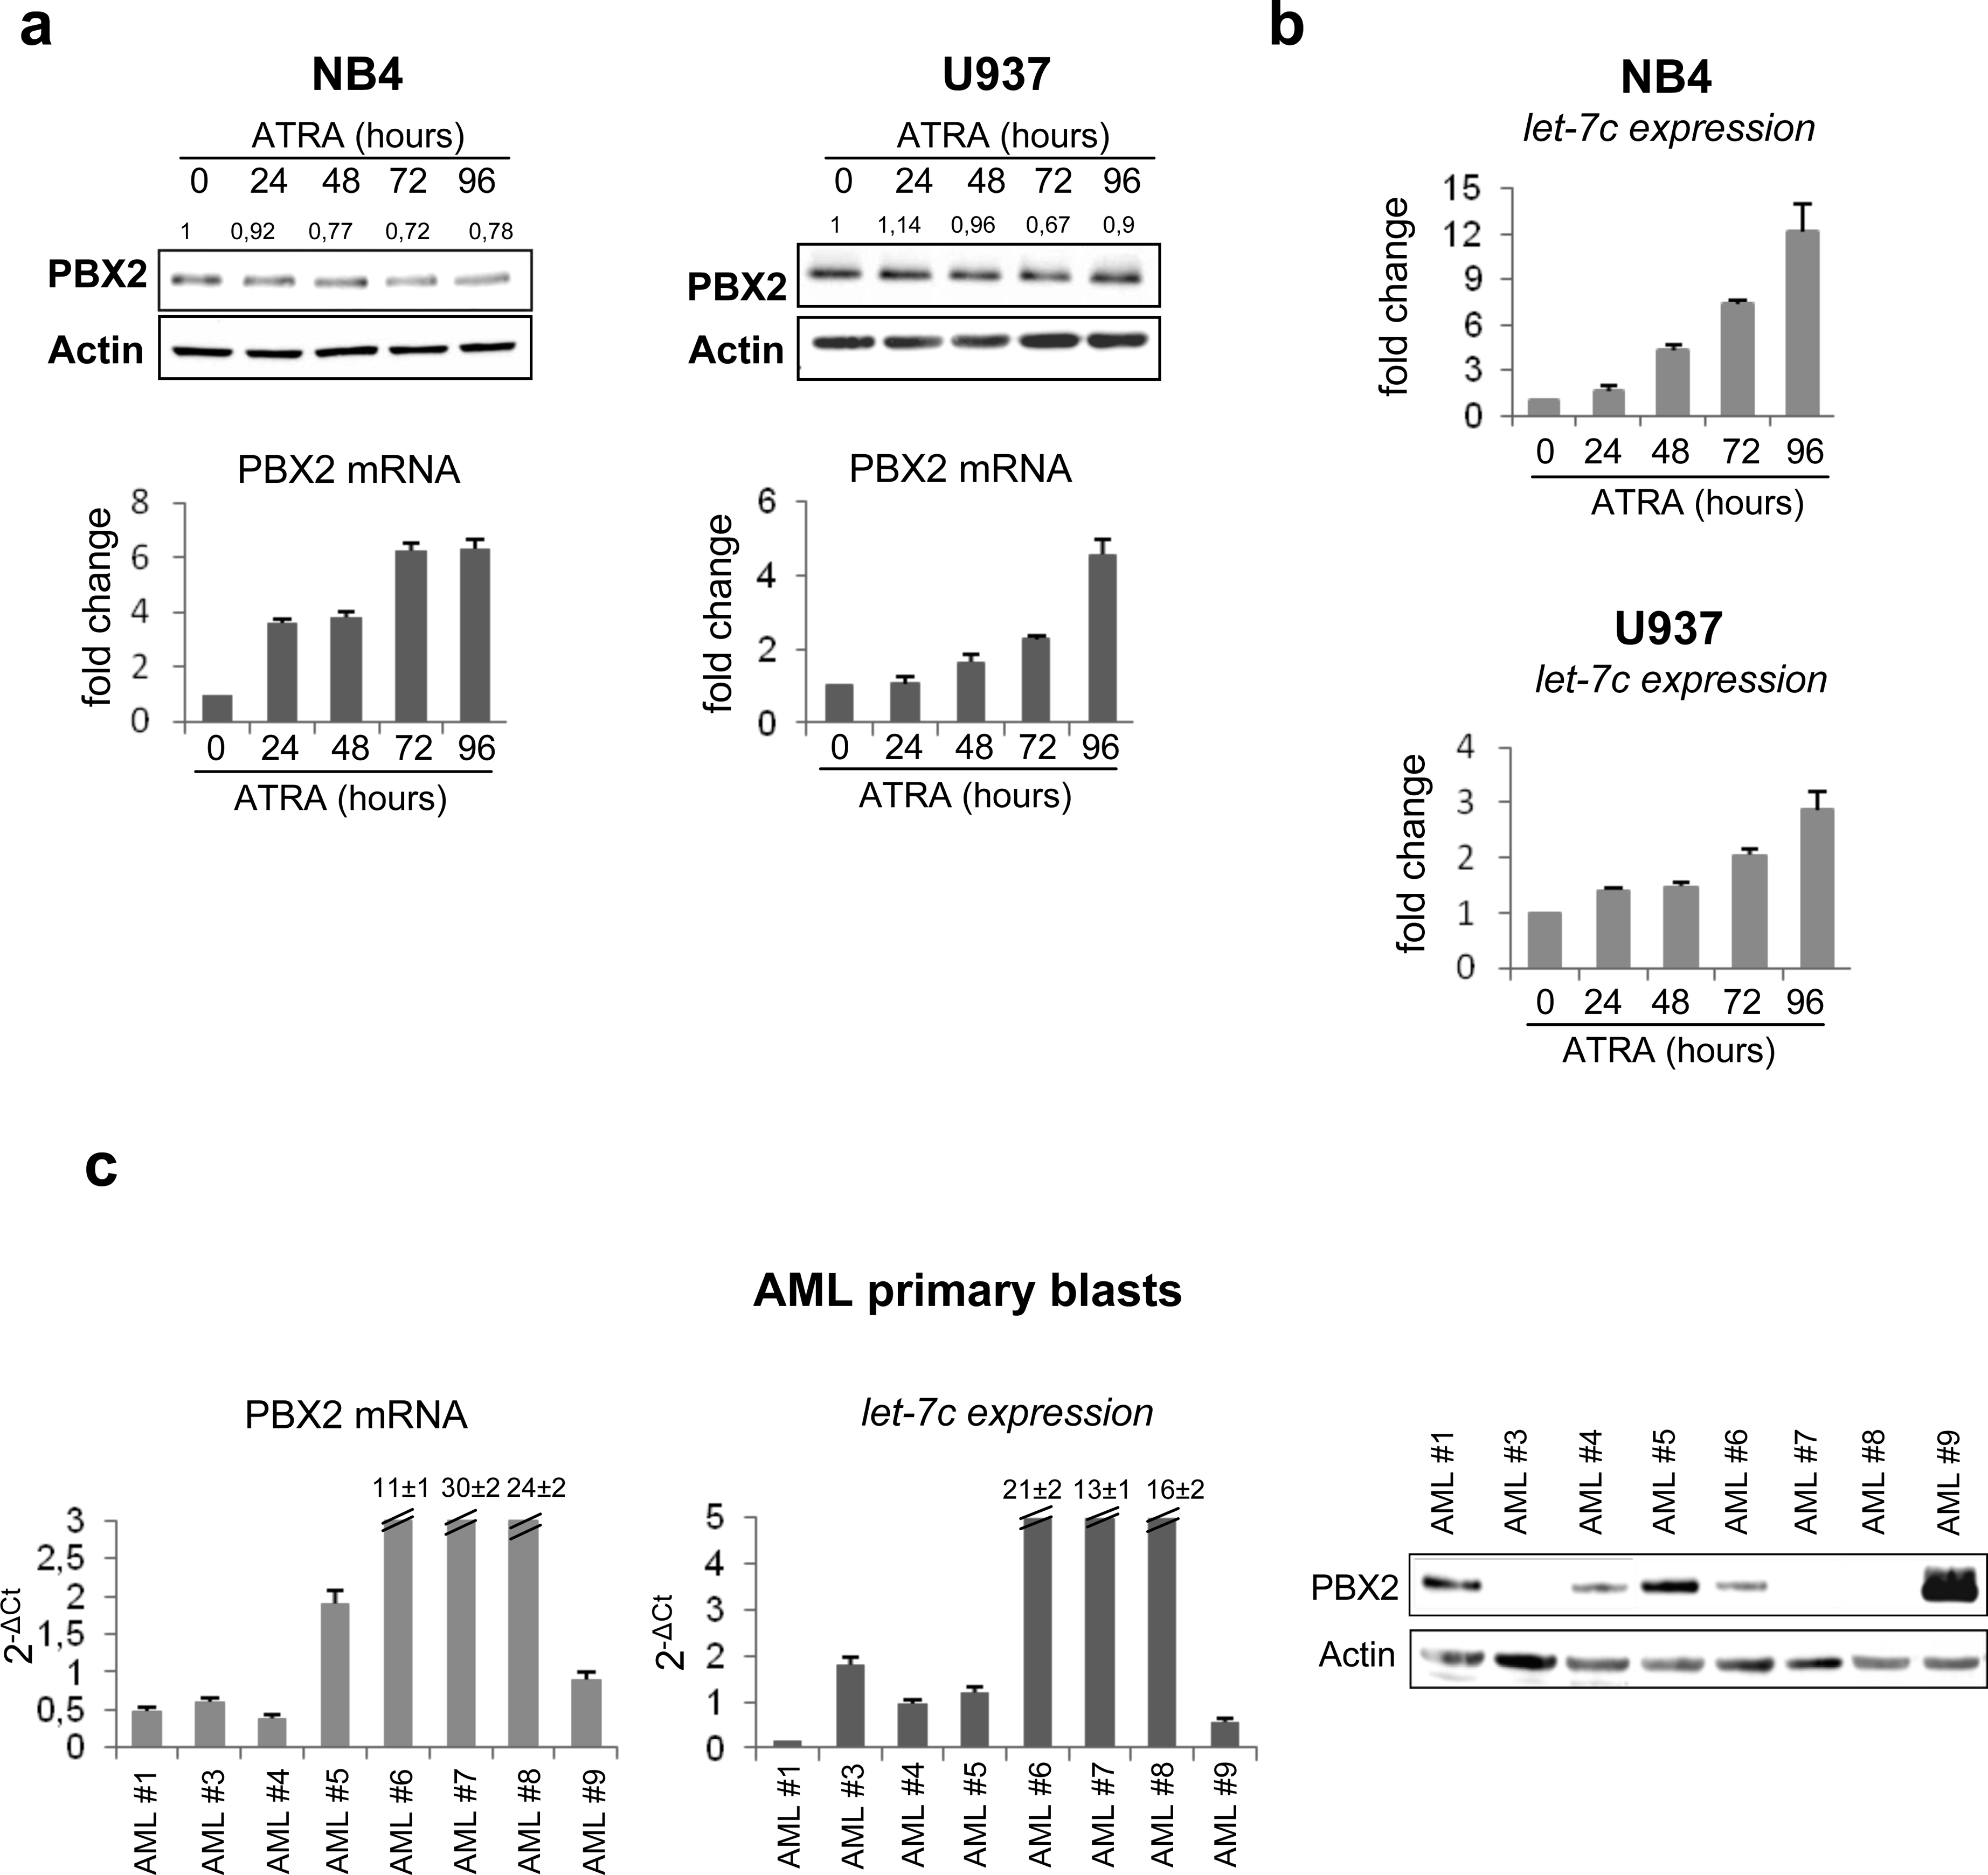
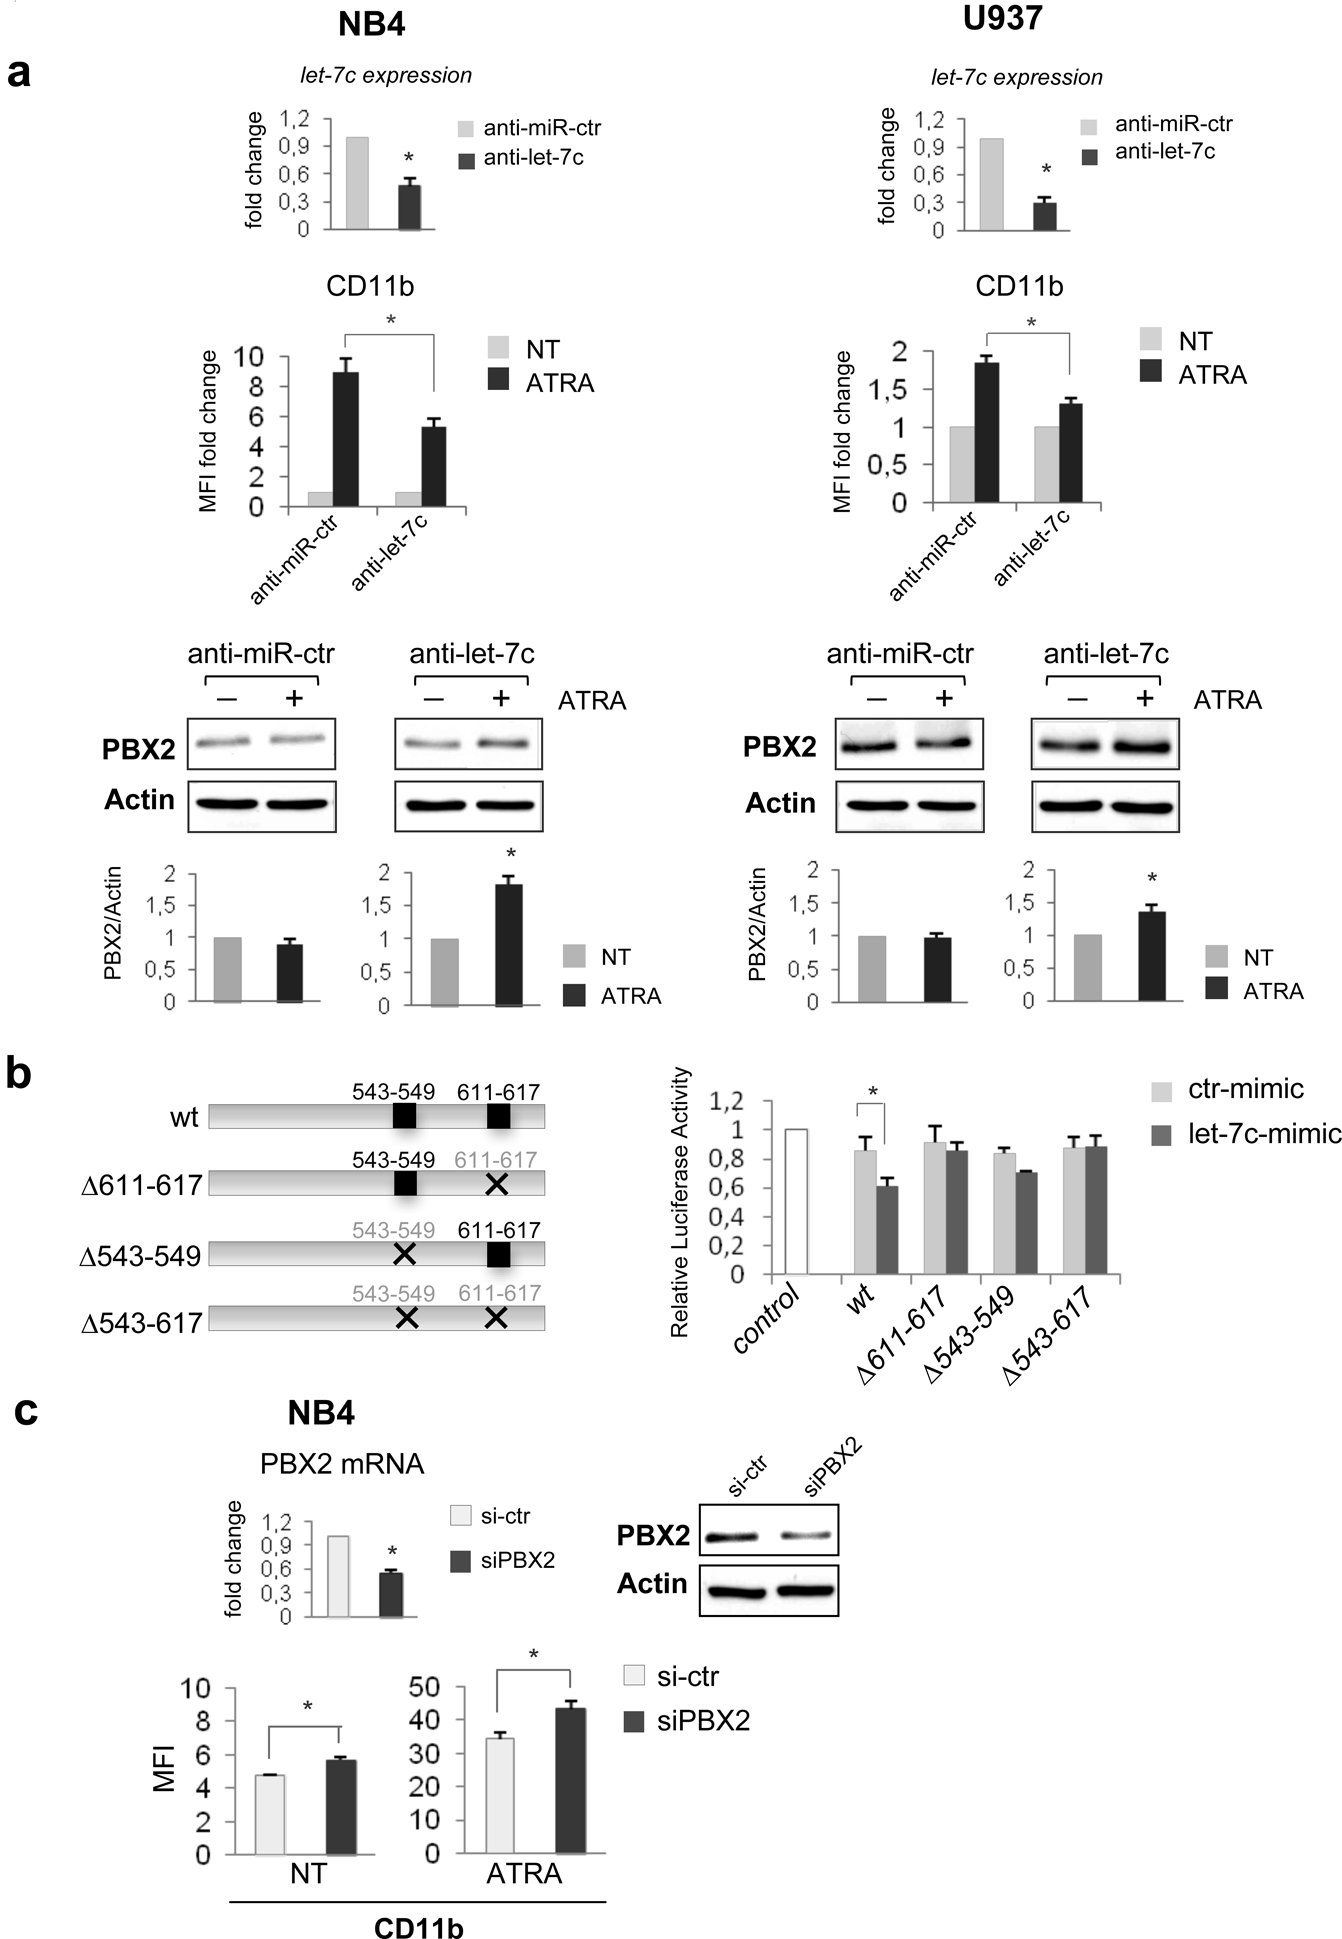
MicroRNAs (miRNAs), small non-coding RNAs that regulate gene expression post-transcriptionally, are involved in many complex cellular processes. Several miRNAs are differentially expressed in hematopoietic tissues and play important roles in normal differentiation, but, when aberrantly regulated, contribute to the abnormal proliferation and differentiation of leukemic cells. Recently, we reported that a small subset of miRNAs is differentially expressed in acute promyelocytic leukemia (APL) blasts and is modulated by treatment with all-trans-retinoic acid (ATRA). In particular, PML/RARα-positive blasts from APL patients display lower levels of miRNA let-7c, a member of the let-7 family, than normal promyelocytes and its expression increases after ATRA treatment. In this study, we investigated the effects of let-7c in acute myeloid leukemia (AML) cells. We found that ectopic expression of let-7c promotes granulocytic differentiation of AML cell lines and primary blasts. Moreover, we identified PBX2, a well-known homeodomain protein whose aberrant expression enhances HoxA9-dependent leukemogenesis, as a novel let-7c target that may contribute to the AML phenotype. Together, these studies raise the possibility that perturbation of the let-7c-PBX2 pathway may have a therapeutic value in AML.


Conflict of interest statement

Conflict of interest

The authors declare no conflict of interest.

Figures

Figure 1.
Figure 1.. Over-expression of miRNA let-7c affects differentiation in AML cell lines and primary blasts
(a) Myeloid cell lines were electroporated (Nucleofector 4D system, Lonza, buffer SF) either with a miRIDIAN hsa-let-7c mimic (let-7c-mimic; 600 nM, Dharmacon) or miRIDIAN mimic negative control #2 (ctr-mimic; 600 nM, Dharmacon). In standardization experiments, transfection efficiency ranged from 41% to 65%, based on the uptake of the fluorescent transfection indicator siGLO (Dharmacon RNATechnologies, Lafayette, CO; data not shown). 24 h after transfection, cells were treated with ATRA (1μM) for 48 hours and analyzed for let-7c and membrane antigen CD11b expression. Total RNA was isolated using Trizol Reagent (Invitrogen). (upper panel) Quantification of ectopic let-7c expression in the indicated myeloid cell lines was assessed by reverse transcriptase reaction using stem-loop primers followed by quantitative real-time polymerase chain reaction (qRT-PCR) performed in accordance with manufacturer’s instructions (Applied Biosystems Inc., Foster City, CA, USA) on an Applied Biosystem 7500 Real Time PCR System SDS v1,2. Samples were normalized for RNU19 small RNA expression. Real-time PCR was performed in triplicate, including no-template controls. Values are reported as fold changes of let-7c-mimic compared to ctr-mimic. Error bars indicate SEM (n = 3). ***P value <0.001 (Student’s t-test). (lower panel) CD11b expression was assessed by FACSCalibur flow cytometer. Acquisition and analysis was performed using Cell Quest Pro Software (Becton Dickinson). Briefly, untreated or ATRA-treated NB4, HL-60 and U937 cells were harvested, washed twice in PBS + 5% FBS and incubated 30 min on ice in the dark with a 1:10 fluorochrome-labeled anti-CD11b PE-conjugated antibody or isotype control (BD Biosciences Pharmingen). Values were expressed as Mean Fluorescence Intensity (MFI). Error bars indicate SEM (n= 3). *P value <0.05 (Student’s t-test). (b) May Grünwald-Giemsa-stained cytospins of untreated or ATRA-treated (1μM, 48 hours) myeloid cell lines overexpressing let-7c-mimic or ctr-mimic oligonucleotides, analyzed at 400× magnification under a microscope (Eclipse 1000; Nikon, Tokyo, Japan) equipped with a digital camera. A representative field is shown. The scale bar represents 20 μm. (c) (upper panel) Quantification of let-7c in lentivirally transduced primary AML blasts. Samples were normalized for levels of RNU19 small RNA. Real-time PCR was performed in triplicate, including no-template controls. Values are reported as fold changes compared to empty vector-transduced samples. Error bars indicate SEM (n = 3). ***P value <0.001 (Student’s t-test). (lower panel) CD11b expression measured by FACS analysis in primary AML blasts after 72h of infection with a lentiviral vector expressing let-7c (let-7c) or with the empty lentiviral vector (mock). GFP-positive cells were analyzed by fluorescence activated cell sorting as described. Values are expressed as MFI fold changes compared to mock infected cells. Error bars indicate SEM (n = 3). *P value <0.05 (Student’s t-test). Methods: Leukemia blasts were obtained from bone marrow collected at diagnosis from four AML patients with normal karyotype. Informed consent was obtained from the patients and the study was approved by the review board and ethic committee of “SC Ematologia” Azienda Ospedaliera Universitaria, Policlinico Tor Vergata in accordance with the Declaration of Helsinki. Blasts isolation and molecular characterization of major fusion proteins were performed as described. RNA extraction, RT-PCR reactions, mature miRNA quantification and CD11b expression was performed as described in the legend of Figure 1a. For the lentivirus let-7c construction, a pU1-let-7c plasmid was generated by cloning a fragment of the pri-let-7c (from −68 to +146 bp relative to the 5’ end of pre-let-7c sequence) into the pSP65-U1 cassette plasmid. The U1-let-7c expression cassette was then sub-cloned into the EcoRV site of the lentiviral vector pRRLSIN-cPPT-PGK-GFP-WPRE. The 3th generation packaging kit was purchased from Invitrogen and used according to the manufacturer’s instructions. Infective particles were produced and utilized as previously described. (d) (left panel) Mature let-7c expression in the indicated myeloid cell lines treated with differentiation-inducing agents was assayed as described in the legend of Figure 1a. Samples were normalized for expression of RNU19 small RNA. For induction of granulocytic differentiation, ATRA (Sigma) was added at a final concentration of 1 μM for 48 hours. For induction of monocytic differentiation, HL-60 cells were treated with TPA alone (50 nM, 48 hours), whereas NB4 cells were treated with TPA and Vitamin D3 (200 nM each) as described., Values are reported as fold changes of let-7c levels in treated versus untreated cells. Error bars indicate SEM (n = 3). *P value <0.05 (Student’s t-test). (right panel) Expression of monocytic-specific membrane antigen CD14 in let-7c-mimic- or ctr-mimic-transfected NB4 and HL-60 cells, untreated or treated with ATRA (1μM; 48 hours). cDNAs were amplified using the TaqMan Gene Expression assay (Hs 02621496_s1 Applied Biosystems). Samples were normalized to levels of β-Actin mRNA transcripts. Values are reported as fold changes compared to untreated ctr-mimic transfected cells. Error bars indicate SEM (n = 3).
Figure 2.
Figure 2.. Putative let-7c targets.
(a) (left panel) Scheme of selected candidate target genes of miRNA let-7c screened by miRanda, TargetScan 5.2, Pictar and miRDB algorithms. Filled spots represent the number of algorithms able to predict the putative target gene of the miRNA let-7c. In bold, genes already experimentally validated as let-7c targets. (right panel) Schematic representation of putative binding sites for miRNA let-7c in the 3’UTRs of the PBX2 and PBX3 genes. (b) Western blots of a representative experiment showing levels of endogenous PBX2 and PBX3 proteins in NB4 cells, 72h after transfection with let-7c or control RNA mimics. Immunoblotting was performed with antibodies against PBX2 and PBX3 (G-20, sc-890 and D-17, sc-891, Santa Cruz). Anti-actin (CP01, Ab-1, Calbiochem), was used as loading control whereas anti pan-RAS (OP40, Ab-3, Calbiochem), a well-known let-7 family target, was used as positive control. In the lower panel, proteins were quantified using the densitometry function of the ImageJ software (NIH, U.S.A), normalized to actin within the same sample and expressed as fold changes compared to control. Three independent experiments are presented. Numbers represent the average density (in arbitrary units) detected by the software normalized for the ctr sample. Error bars indicate SEM (n = 3). *P value <0.05 (Student’s t-test). (c) Western blot assays were used to monitor the expression level of endogenous PBX2 protein in HL-60 and U937 cells, 72h after transfection with let-7c-mimic or control mimic. For each cell line, a representative experiment is shown, and the results from the densitometric analysis of three independent experiments are presented in the histograms. Mean± SEM (n= 3).*P value <0.05 (Student’s t-test). (d) Expression of endogenous PBX2 is suppressed by let-7c. PBX2 RNA quantification in the indicate myeloid cells transfected with let-7c-mimic or control-mimic, was performed using SYBR Green-based qRT-PCR as described. GAPDH gene expression was used as endogenous control. Results (mean ± SEM of three independent experiments) are expressed as fold changes in let-7c mimic versus control-mimic-transfected cells. *P value <0.05 (Student’s t-test).
Figure 3.
Figure 3.. Endogenous PBX2 expression during ATRA treatment.
(a) (upper panel) Western blot of endogenous PBX2 protein in NB4 and U937 cells during ATRA treatment. Numbers above the lanes represent densitometric analysis of PBX2/Actin reported as fold change with respect to untreated samples. Immunoblotting and densitometry were performed as described in the legend of Figure 2b. (lower panel) PBX2 RNA quantification in NB4 and U937 cells, during ATRA treatment, was performed using SYBR Green-based qRT-PCR as described. GAPDH gene expression was used as endogenous control. Results (mean ± SEM of three independent experiments) are expressed as fold changes in ATRA-treated relative to untreated cells. (b) Let-7c expression as evaluated by stem-loop PCR in NB4 and U937 cell lines during ATRA treatment (1μM). Values are reported as fold changes compared to let-7c level in untreated cells. Error bars indicate SEM (n = 3). (c) (left panel) RNA quantification of PBX2 by SYBR Green DNA Master mix and specific primers, available upon request, in AML primary blasts. Values are reported as 2−ΔCt. Samples were normalized to GAPDH gene expression. Error bars indicate SEM (n=3). (middle panel) Let-7c expression evaluated by stem-loop PCR in AML primary blasts. Values are reported as 2−ΔCt. Samples were normalized to RNU19 small RNA levels. Error bars indicate SEM (n=3). (right panel) Western Blot of endogenous PBX2 protein in AML primary blasts. RNA extraction, RT-PCR reactions, mature miRNA quantification and western blots were performed as described in the legend of Figure 1a and 2b.
Figure 4.
Figure 4.. PBX2 is a direct target of let-7c.
(a) (upper panel) Expression level of let-7c, evaluated by stem-loop PCR, in the indicated cell lines after transfection with anti-let-7c or negative control (anti-let-7c or anti-miR-ctr, 800 nM; LNA Exiqon). (middle panel) CD11b expression, measured by FACS analysis, in the indicated myeloid cell lines. 24 h after transfection with anti-let-7c or anti-miR-ctr, cells were treated with ATRA (1μM) for 48 hours and analyzed for expression of the membrane antigen CD11b as described inFfigure 1a. Values are expressed as MFI fold change compared to untreated control. Error bars indicate SEM (n = 3). *P value <0.05 (Student’s t-test). (lower panel) Western blots of endogenous PBX2 protein in NB4 and U937 cells, treated or untreated with ATRA (72 hours), after electroporation with anti-let-7c or anti-miR-ctr. A representative experiment for western blot, performed as described in the legend of Figure 2b, is shown. The intensity for each band was densitometrically quantified and the results of three independent experiments are presented in the histograms. Mean± SEM (n= 3).*P value <0.05 (Student’s t-test). (b) (left panel) Schematic representation of reporter constructs containing the complete (3’UTR wt) or deletion mutants (PBX2-Δ543–549, -Δ611–617, -Δ543-Δ617) of let-7c–binding sequences in PBX2 constructs used to measure luciferase activity. (right panel) Human 293T cells were transiently co-transfected, by Lipofectamine 2000 (Invitrogen), with 50ng of Renilla luciferase pRL-TK and 0.8 μg of firefly luciferase reporter plasmid containing wild-type or the indicated deleted PBX2 3’UTRs (see below for PBX2 3’UTRs plasmid details) and 40 pmol of either the hsa-let-7c mimic or ctr-mimic RNA oligonucleotides. The pRL-TK vector providing constitutive expression of Renilla luciferase was co-transfected as an internal control to correct differences in both transfection and harvest efficiencies. 48h post-transfection with let-7c or control RNA mimic, cells were lysed and luciferase activity quantified using the Dual Luciferase Reporter kit (Promega Inc.), as reported. Firefly luciferase activity of each sample was normalized by Renilla luciferase activity. Results are expressed as fold activation relative to the basal activity of pGL3 empty Control vector (control). The normalized luciferase activity, set as mean of at least three independent experiments done in duplicate, is shown. Error bars represent the mean ± SEM (n = 3). *P value of <0.05 (Student’s t-test). The human PBX2 3’UTR (NM_002586) segment containing the target sites for let-7c were amplified by PCR from genomic DNA and cloned into pGL3 Control vector (Promega) downstream of the luciferase gene. The specific primers used are available upon request. The deletion mutants were obtained by restriction site digestions. All the plasmids were verified by sequence analysis. (c) (upper panel) Expression of endogenous PBX2 mRNA and protein after electroporation of small interference RNAs (siRNA) targeting human PBX2 (siPBX2, 600 nmol; ON-TARGETplus SMARTpool,™ Dharmacon). The control RNA duplex (si-ctr 600 nmol; ON-TARGETplus Non-targeting pool, Dharmacon) for siRNA had no homology to any human genome sequences. For PBX2 mRNA, value is reported as fold changes compared to control-transfected cells. Error bars indicate SEM (n = 3). *P value <0.05 (Student’s t-test). For western blot a representative experiment, performed as described in the legend of Figure 2b, is shown. (lower panel) CD11b expression, measured by FACS analysis, after electroporation with siPBX2 or si-ctr, in the NB4 cell line, treated or untreated with ATRA (48h). Values are expressed as MFI. Error bars indicate SEM (n = 3). *P value <0.05 (Student’s t-test).

Similar articles

Cited by

References

    1. Estey E, Döhner H. Acute myeloid leukemia. Lancet 2006; 368: 1894–1897. - PubMed
    1. de Thè H, Chen Z. Acute promyelocytic leukemia: novel insights into the mechanisms of cure. Nat Rev 2010; 10: 775–783. - PubMed
    1. Farazi TA, Spitzer JI, Morozov P, Tuschl T. miRNAs in human cancer. J Pathol 2011; 223: 102–115. - PMC - PubMed
    1. Calin GA, Croce CM. MicroRNA signatures in human cancers. Nat Rev Cancer 2006; 6: 857–866. - PubMed
    1. Chen CZ, Li L, Lodish HF, Bartel DP. MicroRNAs modulate hematopoietic lineage differentiation. Science 2004; 303: 83–86. - PubMed

Publication types

MeSH terms