

Apolipoprotein E2 accentuates postprandial inflammation and diet-induced obesity to promote hyperinsulinemia in mice
- PMID: 22961083
- PMCID: PMC3554349
- DOI: 10.2337/db12-0390
Apolipoprotein E2 accentuates postprandial inflammation and diet-induced obesity to promote hyperinsulinemia in mice
Abstract
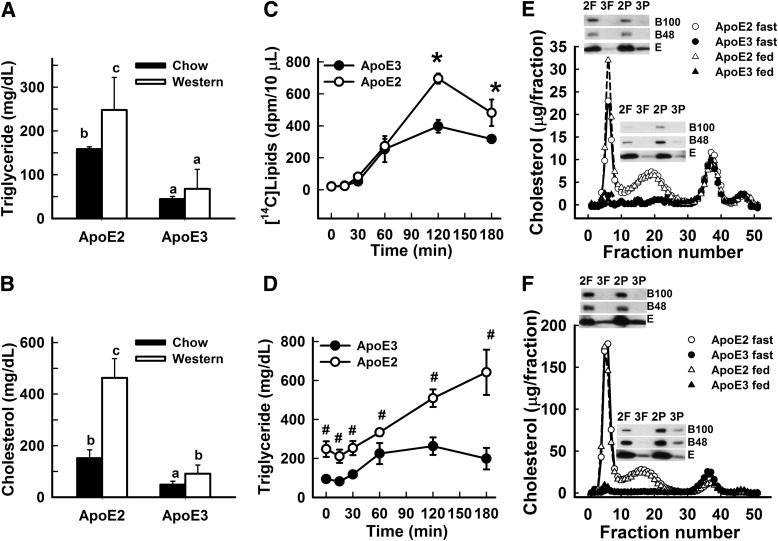
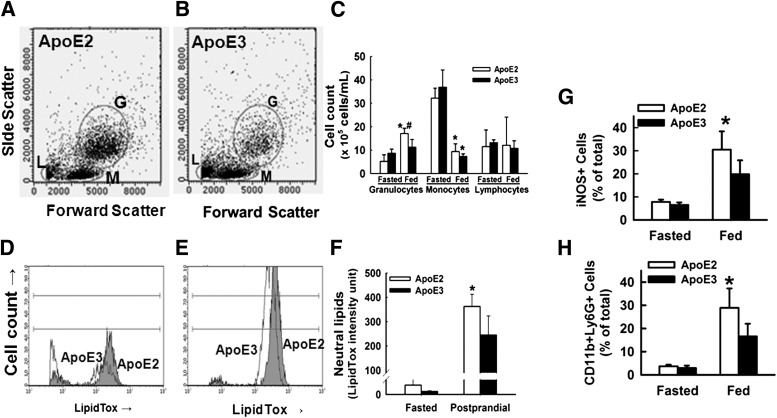
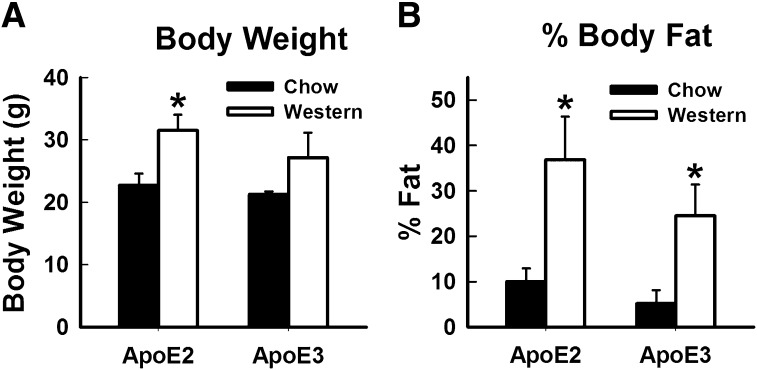
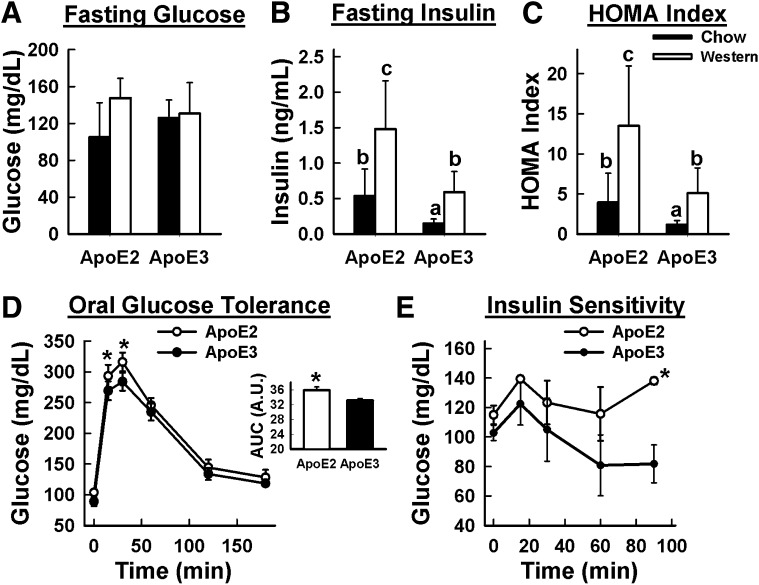
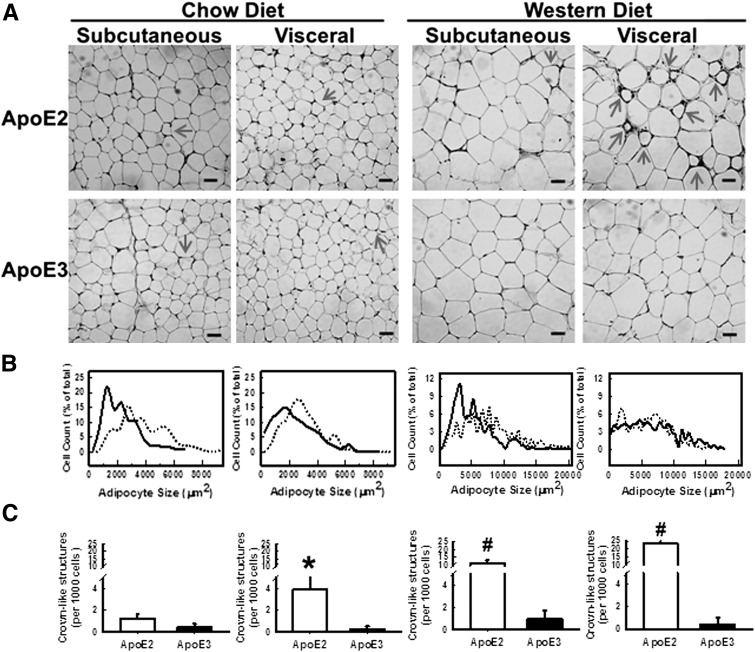
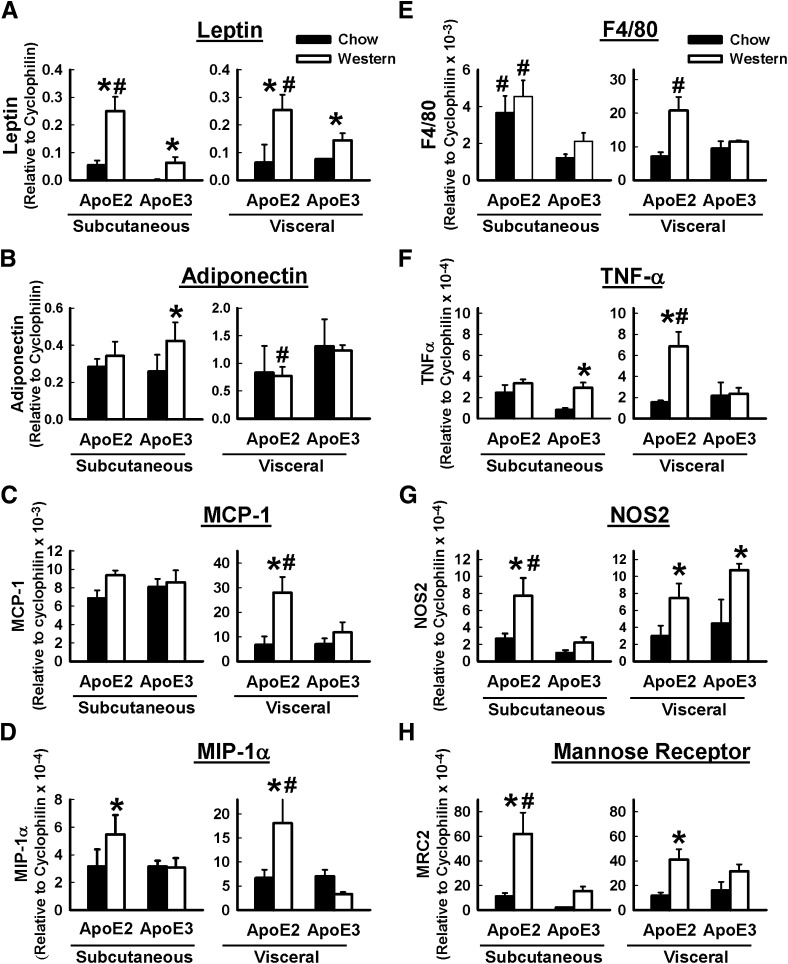
Genetic studies have revealed the association between the ε2 allele of the apolipoprotein E (apoE) gene and greater risk of metabolic diseases. This study compared C57BL/6 mice in which the endogenous mouse gene has been replaced by the human APOE2 or APOE3 gene (APOE2 and APOE3 mice) to identify the mechanism underlying the relationship between ε2 and obesity and diabetes. In comparison with APOE3 mice, the APOE2 mice had elevated fasting plasma lipid and insulin levels and displayed prolonged postprandial hyperlipidemia accompanied by increased granulocyte number and inflammation 2 h after being fed a lipid-rich meal. In comparison with APOE3 mice, the APOE2 mice also showed increased adiposity when maintained on a Western-type, high-fat, high-cholesterol diet. Adipose tissue dysfunction with increased macrophage infiltration, abundant crown-like structures, and inflammation were also observed in adipose tissues of APOE2 mice. The severe adipocyte dysfunction and tissue inflammation corresponded with the robust hyperinsulinemia observed in APOE2 mice after being fed the Western-type diet. Taken together, these data showed that impaired plasma clearance of apoE2-containing, triglyceride-rich lipoproteins promotes lipid redistribution to neutrophils and adipocytes to accentuate inflammation and adiposity, thereby accelerating the development of hyperinsulinemia that will ultimately lead to advanced metabolic diseases.
Figures

Similar articles
-
Differential modulation of diet-induced obesity and adipocyte functionality by human apolipoprotein E3 and E4 in mice.Int J Obes (Lond). 2008 Oct;32(10):1595-605. doi: 10.1038/ijo.2008.143. Epub 2008 Aug 26. Int J Obes (Lond). 2008. PMID: 18725890 Free PMC article.
-
Expression of the human apoE2 isoform in adipocytes: altered cellular processing and impaired adipocyte lipogenesis.J Lipid Res. 2011 Sep;52(9):1733-41. doi: 10.1194/jlr.M017160. Epub 2011 Jul 8. J Lipid Res. 2011. PMID: 21743035 Free PMC article.
-
Impaired secretion of apolipoprotein E2 from macrophages.J Biol Chem. 2007 May 4;282(18):13746-53. doi: 10.1074/jbc.M611754200. Epub 2007 Mar 6. J Biol Chem. 2007. PMID: 17341585
-
[The role of epsilon 2/epsilon 3/epsilon 4 polymorphism of the apolipoprotein E gene in the development of dislipoproteinemia and its influence on the efficacy of the hypolipidemic therapy].Tsitol Genet. 2006 Nov-Dec;40(6):59-72. Tsitol Genet. 2006. PMID: 17243378 Review. Russian.
-
Role of microbiota-derived lipopolysaccharide in adipose tissue inflammation, adipocyte size and pyroptosis during obesity.Nutr Res Rev. 2018 Dec;31(2):153-163. doi: 10.1017/S0954422417000269. Epub 2018 Jan 24. Nutr Res Rev. 2018. PMID: 29362018 Review.
Cited by
-
Differential Effect of APOE Alleles on Brain Glucose Metabolism in Targeted Replacement Mice: An [18F]FDG-μPET Study.J Alzheimers Dis Rep. 2017 Nov 16;1(1):169-180. doi: 10.3233/ADR-170006. J Alzheimers Dis Rep. 2017. PMID: 30480236 Free PMC article.
-
Age, APOE and sex: Triad of risk of Alzheimer's disease.J Steroid Biochem Mol Biol. 2016 Jun;160:134-47. doi: 10.1016/j.jsbmb.2016.03.012. Epub 2016 Mar 8. J Steroid Biochem Mol Biol. 2016. PMID: 26969397 Free PMC article. Review.
-
Insights into the roles of Apolipoprotein E in adipocyte biology and obesity.Int J Obes (Lond). 2024 Sep;48(9):1205-1215. doi: 10.1038/s41366-024-01549-9. Epub 2024 Jun 5. Int J Obes (Lond). 2024. PMID: 38839985 Review.
-
Features of Lipid Metabolism in Humanized ApoE Knockin Rat Models.Int J Mol Sci. 2021 Jul 31;22(15):8262. doi: 10.3390/ijms22158262. Int J Mol Sci. 2021. PMID: 34361033 Free PMC article.
-
Independent associations of TOMM40 and APOE variants with body mass index.Aging Cell. 2019 Feb;18(1):e12869. doi: 10.1111/acel.12869. Epub 2018 Nov 21. Aging Cell. 2019. PMID: 30462377 Free PMC article.
References
-
- Eto M, Watanabe K, Ishii K. Reciprocal effects of apolipoprotein E alleles (epsilon 2 and epsilon 4) on plasma lipid levels in normolipidemic subjects. Clin Genet 1986;29:477–484 - PubMed
-
- Duman BS, Oztürk M, Yilmazer S, Hatemi H. Apolipoprotein E polymorphism in Turkish subjects with type 2 diabetes mellitus: allele frequency and relation to serum lipid concentrations. Diabetes Nutr Metab 2004;17:267–274 - PubMed
Publication types
MeSH terms
Substances
Grants and funding
LinkOut - more resources
Full Text Sources
Medical
Molecular Biology Databases
Miscellaneous
