. 2012 Sep 7;2(9):e87.
doi: 10.1038/bcj.2012.36.

Stromal cells expressing hedgehog-interacting protein regulate the proliferation of myeloid neoplasms

Affiliations

Stromal cells expressing hedgehog-interacting protein regulate the proliferation of myeloid neoplasms

M Kobune et al. Blood Cancer J. .

Abstract

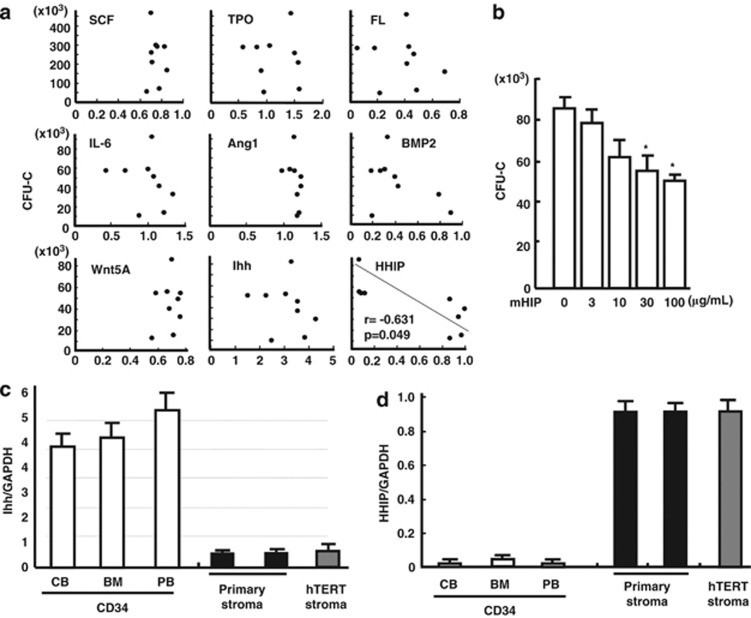
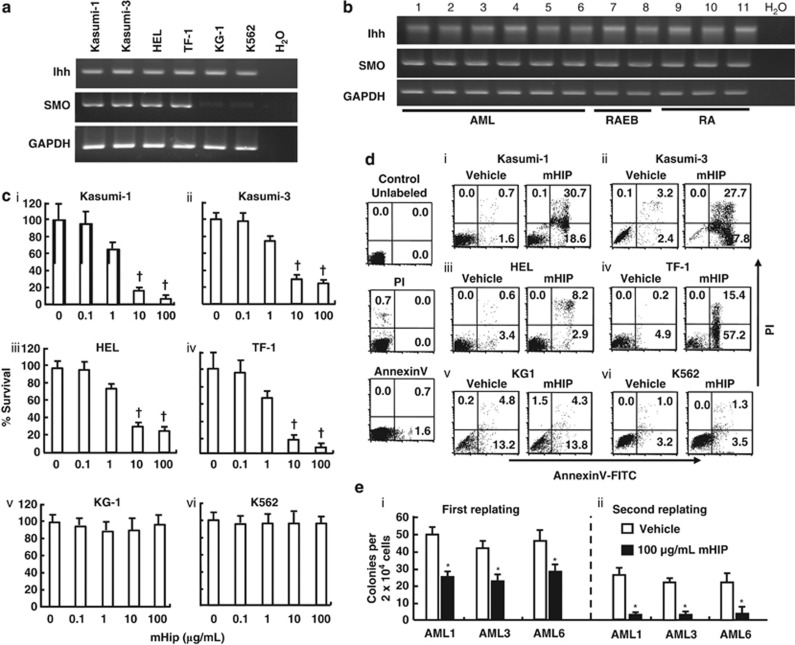
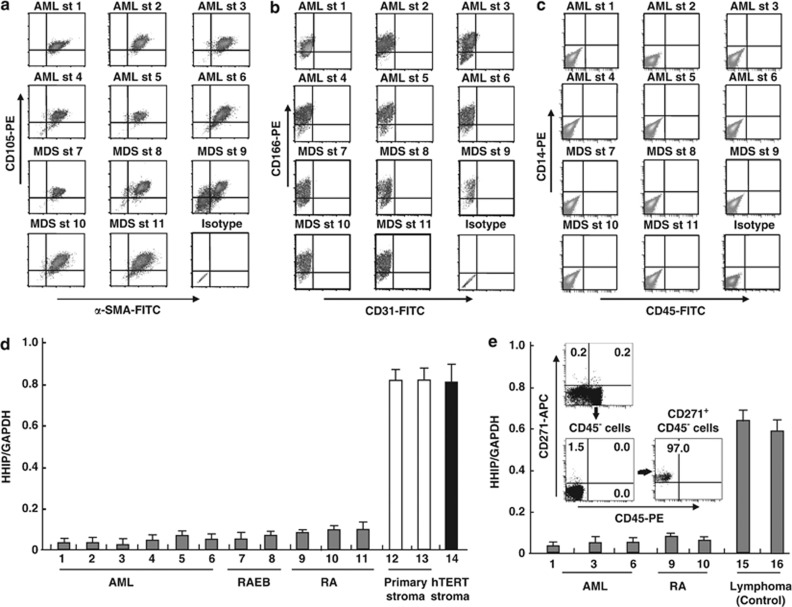
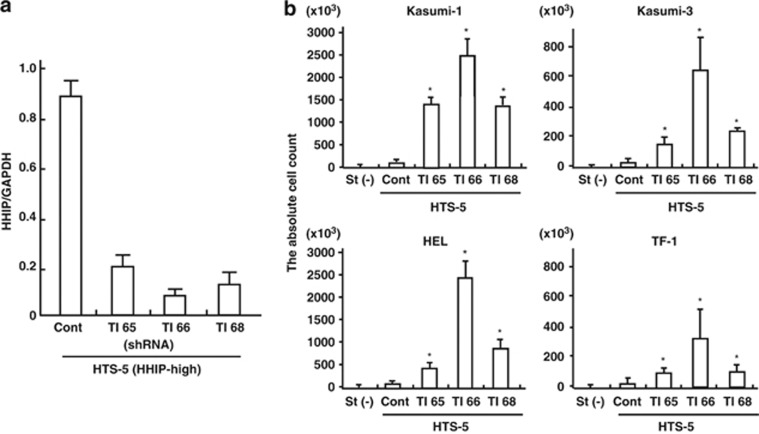
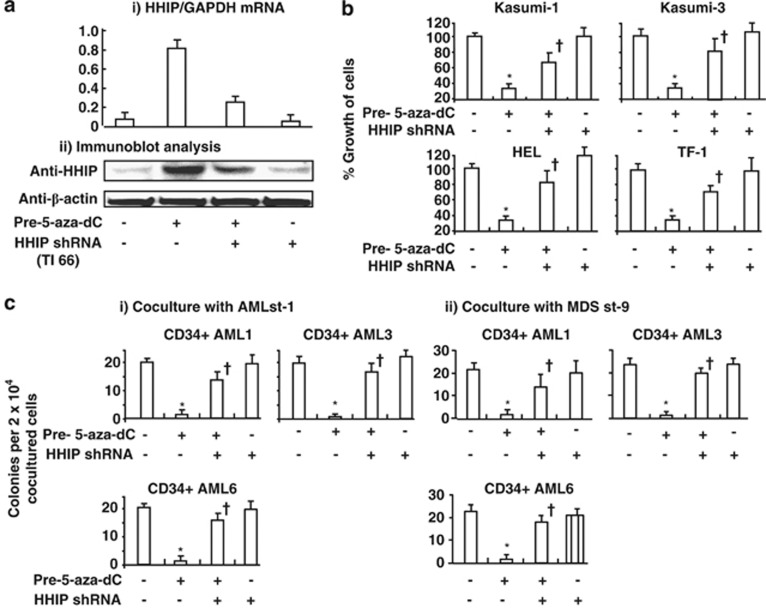
Aberrant reactivation of hedgehog (Hh) signaling has been described in a wide variety of human cancers including cancer stem cells. However, involvement of the Hh-signaling system in the bone marrow (BM) microenvironment during the development of myeloid neoplasms is unknown. In this study, we assessed the expression of Hh-related genes in primary human CD34(+) cells, CD34(+) blastic cells and BM stromal cells. Both Indian Hh (Ihh) and its signal transducer, smoothened (SMO), were expressed in CD34(+) acute myeloid leukemia (AML) and myelodysplastic syndrome (MDS)-derived cells. However, Ihh expression was relatively low in BM stromal cells. Remarkably, expression of the intrinsic Hh-signaling inhibitor, human Hh-interacting protein (HHIP) in AML/MDS-derived stromal cells was markedly lower than in healthy donor-derived stromal cells. Moreover, HHIP expression levels in BM stromal cells highly correlated with their supporting activity for SMO(+) leukemic cells. Knockdown of HHIP gene in stromal cells increased their supporting activity although control cells marginally supported SMO(+) leukemic cell proliferation. The demethylating agent, 5-aza-2'-deoxycytidine rescued HHIP expression via demethylation of HHIP gene and reduced the leukemic cell-supporting activity of AML/MDS-derived stromal cells. This indicates that suppression of stromal HHIP could be associated with the proliferation of AML/MDS cells.


Figures

Figure 1
Figure 1
The expression of Ihh and HHIP in CD34+ hematopoietic cells and primary and telomerized BM stromal cells. (a) Correlation between the number of CFU-C and various soluble factors expressed by HTS clones. A significant reverse correlation between the number of CFU-C and expression level of HHIP in BM stromal cell clones was observed. X axis indicates the ratio of target mRNA to GAPDH mRNA in HTS clones by real-time PCR. (b) The effect of recombinant mHIP on the proliferation of clonogenic cells upon coculture with an hTERT-stromal clone 6 (HTS-6). The coculture was supplemented with 10 ng/ml SCF with or without mHIP. X axis indicates the concentration of mHIP and Y axis indicates the number of CFU-C. Data represent three independent experiments, performed in triplicate. Results are expressed as means±s.d. (c) Endogenous Ihh expression levels in PB, BM or CB CD34+ cells, primary stromal cells or human hTERT-stromal cells were analyzed by real-time PCR. (d) Endogenous HHIP expression levels were analyzed by real-time PCR. The expression level of GAPDH was used as an internal standard.
Figure 2
Figure 2
The effect of mHIP on leukemic cell lines in stroma-free conditions. (a) The expression of Ihh and SMO mRNA in six leukemic cell lines was analyzed by RT-PCR. The expression of GAPDH was used as an internal standard. (b) Ihh and SMO expression in the CD34+ fraction of primary AML/MDS cells was analyzed by RT-PCR. Lane number 1–11 indicates the patient number suffering from AML or MDS (RA: refractory anemia; RAEB: refractory anemia with excess blast). H2O was used as a negative control. (c) Cytotoxic assay of leukemic cell lines. X axis indicates the concentration of recombinant mHIP and Y axis indicates % survival of the cells. The number of surviving cells was assessed by WST-1 assay. (d) Double staining annexin V/PI assay of leukemic cell lines 48 h after exposure of mHIP. ‘Control' indicates controls of unlabeled Kasumi-1 cells and single color controls of PI and Annexin V-FITC staining. Left panels indicate vehicle-treated control and right panels indicate mHIP-treated cells. X axis indicates Annexin V-FITC-positive cells and Y axis indicates PI-positive cells. (e) The replating capacity of the CD34+ fraction of primary leukemic cells derived from patient ID no. 1, 3 and 6 was analyzed in the presence or absence of mHIP. Unlike control cultures (Vehicle), cultures with mHIP showed reduced replating capacity over three replatings (only two replatings are shown). Similar results were obtained in two independent experiments, each performed in triplicate. Results are expressed as means±s.d.
Figure 3
Figure 3
Immunophenotypical analysis and HHIP expression of primary stromal cells derived from AML/MDS patients. (a) Immunophenotypical analysis of stromal cells derived from AML/MDS patients. X axis indicates α-SMA-FITC and Y axis indicates CD105-PE. (b) Additional immunophenotypical analysis of CD31-FITC and CD166-PE (ALCAM) antibodies. Data shown are representative of one experiment of three showing similar results. (c) Immunophenotypical analysis of CD45-FITC and CD14-PE antibodies. (d) HHIP expression in BM stromal cells was analyzed by real-time PCR. Lane number 1–11 indicates each patient number. Lane 12 and 13 indicate HHIP expression in primary BM stromal cells derived from different healthy volunteers. Lane 14 indicates hTERT-stromal cells (around 30 population doubling after hTERT gene transfer). Y axis indicates the ratio of HHIP to GAPDH mRNA. (e) HHIP expression in primary uncultured CD271+CD45 cells. The percentage of CD271+CD45 cells before selection was analyzed by CD271-APC/CD45-PE (upper panel). Cell debris and dead cells were excluded from the analysis based on scatter signals and PI fluorescence. BM mononuclear cells were negatively selected by CD45-PE/anti-PE microbeads (lower left panel) and positively selected by CD271-APC/anti-APC microbeads (lower right panel) when sufficient numbers of BM MNCs were obtained (number 1, 3, 6, 9 and 10). Purified CD271+CD45 cells were directly transcribed and HHIP expression was analyzed by real-time PCR. BM MNCs obtained from lymphoma patients without BM involvement were used as a control for BM cells (number 15 and 16).
Figure 4
Figure 4
The supporting activity of BM-derived stromal clones on leukemic cells in aserum-free medium. (a) The correlation between the cell number of cocultured leukemic cell lines and the expression level of stromal HHIP in HTS clones. A significant reverse correlation was observed in four SMO+ leukemic cell lines, but not in SMO leukemic cells lines such as KG-1 and K562. (b) The growth of SMO+ leukemia cell lines in coculture with stroma free (st (−)), HTS-5 (HHIP highest) or HTS-6 (HHIP lowest) stromal layer for 4 weeks. Twenty thousand leukemic cells were added to serum-free culture medium. For TF-1 culturing, 10 ng/ml of SCF was added every week. Y axis indicates the absolute number of cells from each culture system. *P<0.05, HTS-5 vs HTS-6. (c) The difference between the percentage of apoptotic cells on coculture with HTS-5 and HTS-6 by Annexin V/PI assay. X axis indicates Annexin V-FITC-positive cells and Y axis indicates PI-positive cells. ‘Control' indicates controls of unlabeled Kasumi-1 cells and single color controls of PI and Annexin V-FITC. HTS-5: left panel; HTS-6: right panel. Data shown are from one representative experiment of three showing similar results. (d) Cell cycle analysis of leukemic cells by PI staining. Four SMO+ leukemic cell lines and two SMO leukemic cell lines (K562 and KG-1) were cocultured with HTS-5 or HTS-6 for 1 week and cell cycle entry of leukemic cells was analyzed. Data shown are from one representative experiment of three showing similar results.
Figure 5
Figure 5
The effect of HHIP knockdown on the leukemia-supporting activity of stromal cells. (a) HHIP shRNA expression vectors or control vector (shRNA empty pRS vector) were transduced into HTS-5. The expression of HHIP in Cont-HTS-5 (Control), TI 65-HTS-5 (TI 65), TI 66-HTS-5 (TI 66) or TI 68-HTS-5 (TI 68) was analyzed by real-time PCR. (b) The growth of SMO+ leukemic cell lines, Kasumi-1, Kasumi-3, HEL and TF-1 in coculture with control, TI 65, TI 66 or TI 68 stromal cells in a serum-free medium. The absolute number of cells was counted after 4 weeks coculture. The initial number of cells was 2 × 10⁴. Data shown are from one representative experiment of three showing similar results. *P<0.01, control vs TI 65, TI 66, or TI 68.
Figure 6
Figure 6
Methylation of HHIP promoter of HHIP-reduced stromal cells. (a) Reactivation of HHIP expression by 5-aza-dC treatment in HTS-6, primary AML st-1 or MDS st-9. HTS-5 was used as a negative control. (i) The restoration of HHIP expression was analyzed by real-time RT-PCR. Open bars represent HHIP mRNA expression in non-treated stromal cells and closed bars represent 5-aza-dC-treated stromal cells. *P<0.05, HHIP/GAPDH mRNA levels in non-treated cells vs that in 5-aza-dC-treated cells. (ii) Upper panel indicates methylation in the promoter region of the HHIP gene in stromal cell lines with or without 5-aza-dC treatment by MSP analysis. Lower panel indicates MSP analysis of HHIP promoter lesion in control methylated DNA and bisulfite treated DNA provided by Methylamp Universal Methylated DNA kit. Maker indicates 100 bp DNA ladder. Data shown are from one representative experiment of two showing similar results. ‘M' represents methylated cytosine and ‘U' represents non-methylated cytosine that was converted to uracil after bisulfite treatment. (b) The changes in expression levels of SCF, TPO and FL after 5-aza-dC treatment were examined by real-time PCR. The expression levels of GAPDH mRNA were used as a standard. Open bars represent mRNA expression in non-treated stromal cells and closed bars represent that in 5-aza-dC-treated stromal cells.
Figure 7
Figure 7
The leukemia-supporting activity in HHIP-low stromal clones (HTS-6) and primary AML/MDS-derived stromal cells after modulation of stromal HHIP expression. (a) HHIP shRNA expression retrovirus vector was transduced into HTS-6, establishing TI66-HTS-6. HTS-6 and TI66-HTS-6 were exposed to 5-aza-dC and washed with PBS before use. The expression of HHIP in HTS-6, 5-aza-dC pretreated HTS-6 and TI66-HTS-6 was confirmed by (i) real-time PCR and (ii) immunoblot analysis. (b) SMO+ leukemic cell lines, Kasumi-1, Kasumi-3, HEL and TF-1 were cocultured with HTS-6 or 5-aza-dC-pretreated HTS-6 and HHIP knockdown TI66-HTS-6 in serum-free medium for 4 weeks. *P<0.05, HTS-6 vs 5-aza-dC pretreated HTS-6. P<0.05, 5-aza-dC pretreated HTS-6 vs 5-aza-dC-pretreated TI66-HTS-6. ‘Pre-5-aza-dC' indicates coculture with 5-aza-dC-pretreated stromal cells, ‘HHIP shRNA (+)' indicates coculture with TI 66-HTS-6 and ‘HHIP shRNA (−)' indicates coculture with mock-transfected Cont-HTS-6. (c) The replating capacity of CD34+ fraction of primary leukemic cells cocultured with AML/MDS-derived stromal cells was analyzed. The primary CD34+ leukemic cells derived from patient ID no. 1, 3 and 6 was cocultured with (i) primary AML st-1 and 5-aza-dC pretreated AML st-1 cells or (ii) primary MDS st-9 and 5-aza-dC-pretreated MDS st-9 cells with transduction of control or HHIP shRNA expression vector. Four weeks after coculture, 2 × 10⁴ leukemic cells cocultured on a stromal layer were placed into methylcellulose. Y axis indicates the number of colonies per 2 × 10⁴ cells. *P<0.05, primary AML/MDS-derived stromal cells vs 5-aza-dC pretreated stromal cells (Student's t-test, two-tailed). P<0.05, 5-aza-dC-pretreated AML/MDS-derived stromal cells vs 5-aza-dC-pretreated AML/MDS-derived stromal cells with HHIP shRNA transduction. Data shown are from three independent experiments, each done in triplicate. Results are expressed as means±s.d.

Similar articles

Cited by

References

    1. Deguchi K, Gilliland DG. Cooperativity between mutations in tyrosine kinases and in hematopoietic transcription factors in AML. Leukemia. 2002;16:740–744. - PubMed
    1. Yoshida K, Sanada M, Shiraishi Y, Nowak D, Nagata Y, Yamamoto R, et al. Frequent pathway mutations of splicing machinery in myelodysplasia. Nature. 2011;478:64–69. - PubMed
    1. Papaemmanuil E, Cazzola M, Boultwood J, Malcovati L, Vyas P, Bowen D, et al. Somatic SF3B1 mutation in myelodysplasia with ring sideroblasts. N Engl J Med. 2011;365:1384–1395. - PMC - PubMed
    1. Wang L, Gural A, Sun XJ, Zhao X, Perna F, Huang G, et al. The leukemogenicity of AML1-ETO is dependent on site-specific lysine acetylation. Science. 2011;333:765–769. - PMC - PubMed
    1. Blau O, Baldus CD, Hofmann WK, Thiel G, Nolte F, Burmeister T, et al. Mesenchymal stromal cells of myelodysplastic syndrome and acute myeloid leukemia patients have distinct genetic abnormalities compared with leukemic blasts. Blood. 2011;118:5583–5592. - PMC - PubMed