. 2012 Sep;22(9):1723-34.
doi: 10.1101/gr.127712.111.

Sequence and chromatin determinants of cell-type-specific transcription factor binding

Affiliations

Sequence and chromatin determinants of cell-type-specific transcription factor binding

Aaron Arvey et al. Genome Res. 2012 Sep.

Abstract

Gene regulatory programs in distinct cell types are maintained in large part through the cell-type-specific binding of transcription factors (TFs). The determinants of TF binding include direct DNA sequence preferences, DNA sequence preferences of cofactors, and the local cell-dependent chromatin context. To explore the contribution of DNA sequence signal, histone modifications, and DNase accessibility to cell-type-specific binding, we analyzed 286 ChIP-seq experiments performed by the ENCODE Consortium. This analysis included experiments for 67 transcriptional regulators, 15 of which were profiled in both the GM12878 (lymphoblastoid) and K562 (erythroleukemic) human hematopoietic cell lines. To model TF-bound regions, we trained support vector machines (SVMs) that use flexible k-mer patterns to capture DNA sequence signals more accurately than traditional motif approaches. In addition, we trained SVM spatial chromatin signatures to model local histone modifications and DNase accessibility, obtaining significantly more accurate TF occupancy predictions than simpler approaches. Consistent with previous studies, we find that DNase accessibility can explain cell-line-specific binding for many factors. However, we also find that of the 10 factors with prominent cell-type-specific binding patterns, four display distinct cell-type-specific DNA sequence preferences according to our models. Moreover, for two factors we identify cell-specific binding sites that are accessible in both cell types but bound only in one. For these sites, cell-type-specific sequence models, rather than DNase accessibility, are better able to explain differential binding. Our results suggest that using a single motif for each TF and filtering for chromatin accessible loci is not always sufficient to accurately account for cell-type-specific binding profiles.


Figures
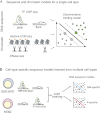
Figure 1.
Figure 1.
Schematic of models to predict transcription factor occupancy from sequence and chromatin. (A) We developed DNA sequence and chromatin models based on flexible k-mer patterns and spatial organization of histone modifications and DNase accessibility. The models were trained to discriminate between regulatory ChIP-seq peaks and flanking regions within a single cell type using a support vector machine. (B) To study cell-type–specific DNA sequence preferences, we simultaneously train on binding site data from two cell types. This allowed us to jointly learn the cell-type–specific preferences (top and bottom).
Figure 2.
Figure 2.
SVM sequence models better predict binding sites than traditional motif approaches. (A) The accuracy of our method is assessed by the area under the ROC curve, which provides a natural trade-off between false positives (x-axis) and sensitivity (y-axis). The ROC curve is shown for discriminating BCL11A ChIP-seq peaks from nonpeaks using four approaches: k-mer SVM, MDscan, cERMIT, and Weeder. (B) The accuracy (AUC) of k-mer SVM models (y-axis) is compared against motif-based algorithms (MDscan, cERMIT, DME, and Weeder; x-axis) for discriminating ChIP-seq peaks from flanking regions. We used training and test sets taken from the same experiment; only accuracy on the test set is shown. Results for transcription factors with multiple ChIP-seq experiments for replicates and cell types were averaged. The SVM models are significantly more accurate than each of the alternative methods (P-values inset and color-coded for each method). (C) The k-mer SVM model is able to learn degenerate motifs. We show the k-mer SVM scores (y-axis) versus the cERMIT motif score (x-axis) for binding sites of BCL11A in GM12878. Example binding sites that are detected by the SVM but receive low scores by the motif are enriched for a more degenerate motif instance, as found by MEME.
Figure 3.
Figure 3.
SVM spatial chromatin models better predict binding sites than simpler models. (A) The distribution of histone marks over 5000-bp windows centered at GABPA ChIP-seq peaks in K562 shows spatial organization of multiple correlated signals. (B) The accuracy of multiple chromatin models suggests that spatial signatures of DNase accessibility better predict binding sites than other methods. The cumulative distributions of prediction accuracy (AUC; x-axis) across a subset of ChIP-seq experiments are shown for multiple chromatin representations. Shown are an SVM model trained on all spatially binned histone marks (blue), which is more accurate than standard ranking based on best single mark read counts (black) or a logistic regression combination of read counts (red); similarly, an SVM model trained on spatially binned DNase-seq reads (brown) better describes binding sites than use of DNase bin counts (purple). Paired signed rank test P-values are shown. (C) Transcription factors that bind the core promoter, proximal to transcript start site, or distal to start site have distinctive spatial patterns of histone modifications. The four plots show spatial coordinates of the learned bin weights arranged along the x-axis, with the values of the weights shown on the y-axis. The bin weightings are averaged across subsets of core, proximal, and distal binding transcription factors. The valleys at the binding site suggest that spatial models are capturing predictive information regarding the differential spacing of nucleosome-depleted regions at core, proximal, and distal binding sites.
Figure 4.
Figure 4.
Combining chromatin and sequence models improves binding site prediction. (A) Binding sites for REST and PAX5 illustrate loci that have a high sequence signal or DNase accessibility, but not both. (B) Learning sequence models in a single cell type reveals that some TFs are better predicted by sequence signals (such as REST), whereas others are better predicted by DNA accessibility (such as EP300 and PAX5). The AUC was determined for each replicate in each cell type and then averaged. (C) When DNase accessibility information is added to k-mer SVM models, the combined model is more predictive of in vivo binding sites. The scatter plot compares the accuracy of a combination of sequence and DNase SVM signatures with that of the sequence model alone. Models were learned from one cell type and then used to predict binding sites in the same cell type (black) or a different cell type (red). Accuracy (AUC) for each TF was averaged across replicates and cell lines (same cell case) or only replicate experiments (transfer learning case). JUND is an outlier, where applying the sequence model across cell lines is significantly worse than applying it in the same cell line. POLR3 is poorly predicted in all settings and is not shown.
Figure 5.
Figure 5.
Cell-type–specific transcription factor binding is measured by ChIP-seq and correlated with differential gene expression. (A) ChIP-seq of USF1 reveals sites that are bound in both cell lines (left), only GM12878 (middle), or only K562 (right). Units are reads per million aligned (RPM). (B) We find cell-type–specific binding sites by measuring replicate-to-replicate noise and comparing it to cell-to-cell variation. Replicate and cell-specific binding are shown for REST, MAX, and JUND. The top row of scatterplots shows the ChIP-seq read counts [in RPM, scaled by log(x + 1)] for the top 5000 peaks in two replicate experiments in the same cell type (GM12878). The bottom row of scatterplots shows the log ChIP-seq read counts in GM12878 versus K562 for the union of the top 5000 peaks in each cell line. In these plots, each point is a binding site, and the x- and y-axes show the log read counts aligning to the site in the respective replicates (top row) or cell types (bottom row). (C) We find that the most proximal genes near cell-type–specific binding sites are differentially expressed between cell types. The cumulative distribution of log expression level changes are shown. Expression is estimated by RNA-seq in units of reads per thousand nucleotides of transcript per million reads aligned (RPKM).
Figure 6.
Figure 6.
Cell-type–specific TF binding is associated with differential DNase accessibility, sequence signal, or both. (A) Differential DNase accessibility (color) is shown for K562 versus GM12878 with respect to cell-type–specific binding (x-axis for GM12878; y-axis for K562). Each point represents a single binding site, and if there are a sufficient number of points in a region, their value is averaged and appears as a square. DNase accessibility, as measured by read-counts, for USF1 (top) correlates with cell-specific binding. This contrasts with YY1 (bottom), where DNase accessibility is evenly distributed across cell-type–specific and nonspecific peaks. (B) Differential sequence preference (color) is shown for K562 versus GM12878. k-mer SVM models are learned from K562 and GM12878 binding sites, and their differential scores are shown by color gradient. For YY1, but not USF1, we see that the differential k-mer SVM scores distinguish cell-type–specific binding sites. (C) Binding sites with differential TF occupancy also have differential DNase accessibility. Each line represents a TF that has been assayed in GM12878 and K562. The x-axis plots a ranking from the most K562-specific binding site to the most GM12878-specific binding sites, based on cell-to-cell log read count ratios, while the y-axis shows the difference in DNase-accessibility ranks in GM12878 and K562. The line plot is smoothed using the mean over a window of 500 binding sites. (D) For the same TFs, we plot the difference in K562- and GM12878-specific k-mer SVM score ranks (y-axis) as a function of the ranking of cell-to-cell log read count ratios, from the most K562-specific binding site to the most GM12878-specific binding sites. The line plot is smoothed using the mean over a window of 500 binding sites.
Figure 7.
Figure 7.
Cell-type–specific sequence models for JUND and YY1 capture different primary motifs. (A) Cell-type–exclusive JUND sites were scored by the GM12878- and K562-specific k-mer SVM models (x- and y-axes, respectively) to identify groups of differentially scored sites. Sites with high K562 and low GM12878 scores (red) and high GM12878 and low K562 scores (blue) were used as input to MEME to produce the different sequence motifs shown with significance P < 10−77. (B) Same as previous panel but using cell-type–exclusive YY1 binding sites with significance P < 10−21.
Figure 8.
Figure 8.
Cell-type–specific sequence models can predict cell-type–specific binding at loci that are DNase accessible in both cell lines. (A) The number of binding sites, cell-type–exclusive binding sites, and exclusive binding sites that are DNase accessible in GM12878. (B) Cell-type–exclusive binding sites can be explained by cell-type–specific sequence preferences when a binding site is accessible in both cell lines. Cell-type–exclusive binding sites for USF1, YY1, and JUND are shown. For USF1, all GM12878- and K562-exclusive binding sites are shown, and DNase accessibility is able to explain cell-type–exclusive binding. In contrast, for JUND and YY1, there are cell-type–exclusive binding sites in GM12878 and K562 that are DNase accessible in both cell lines, and only these examples are plotted in the middle and bottom heatmaps. For these examples, the cell-type–specific SVM sequence scores can explain the cell-type–specific binding. (C) AUC values for the task of discriminating between GM12878-exclusive peaks and K562-exclusive peaks by differential DNase reads (x-axis) or by cell-type–specific SVM sequence scores. For the SVM models, the GM12878- and K562-specific models were each used to discriminate between GM12878- and K562-exclusive binding sites, and the mean AUC over both models was reported. Binding site sequences used in training the models were held out of test sets for this evaluation. For most TFs, the cell-type–exclusive binding sites are well-predicted by differential DNase accessibility (I, IV). For REST, DNase is not predictive in general and the SVM models are consistent between the two cell lines (II). For JUND and YY1 (III), DNase is not predictive of cell-type–exclusive binding, as many sites are DNase accessible in both cell lines; however, the cell-type–specific peaks tend to have different underlying k-mer sequences, enabling accurate discrimination by cell-type–specific SVM sequence models.

Similar articles

Cited by

References

    1. Agius P, Arvey A, Chen W, Noble WS, Leslie C 2010. High resolution models of transcription factor-DNA affinities improve in vitro and in vivo binding predictions. PLoS Comput Biol 6: e1000916 doi: 10.1371/journal.pcbi.1000916 - PMC - PubMed
    1. Bailey TL, Elkan C 1994. Fitting a mixture model by expectation maximization to discover motifs in biopolymers. Proceedings of ISMB 2: 28–36 - PubMed
    1. Bailey TL, Noble WS 2003. Searching for statistically significant regulatory modules. Bioinformatics 19: ii16–ii25 - PubMed
    1. Barrera LO, Li Z, Smith AD, Arden KC, Cavenee WK, Zhang MQ, Green RD, Ren B 2008. Genome-wide mapping and analysis of active promoters in mouse embryonic stem cells and adult organs. Genome Res 18: 46–59 - PMC - PubMed
    1. Boyle AP, Song L, Lee B-K, London D, Keefe D, Birney E, Iyer VR, Crawford GE, Furey TS 2011. High-resolution genome-wide in vivo footprinting of diverse transcription factors in human cells. Genome Res 21: 456–464 - PMC - PubMed

Publication types

MeSH terms

LinkOut - more resources