

Deep sequencing of subcellular RNA fractions shows splicing to be predominantly co-transcriptional in the human genome but inefficient for lncRNAs
- PMID: 22955974
- PMCID: PMC3431479
- DOI: 10.1101/gr.134445.111
Deep sequencing of subcellular RNA fractions shows splicing to be predominantly co-transcriptional in the human genome but inefficient for lncRNAs
Abstract
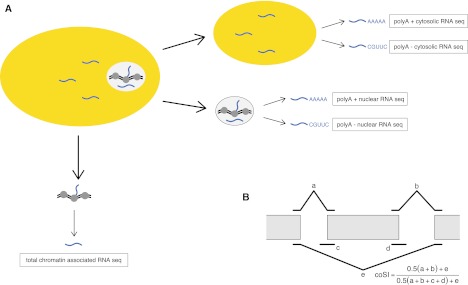
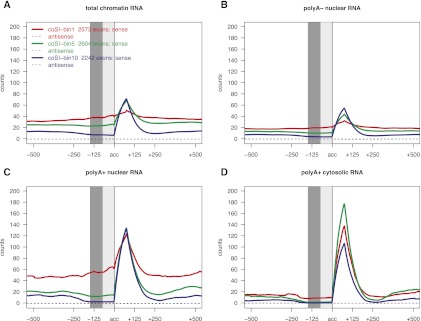
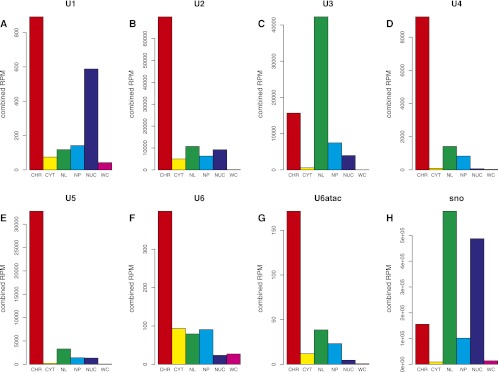
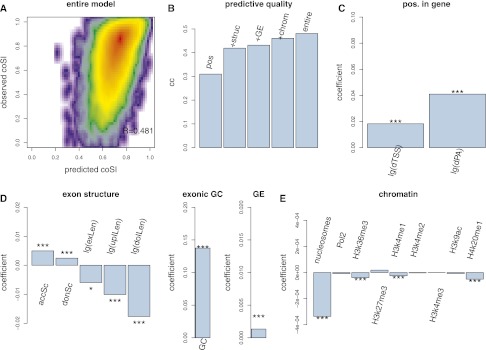
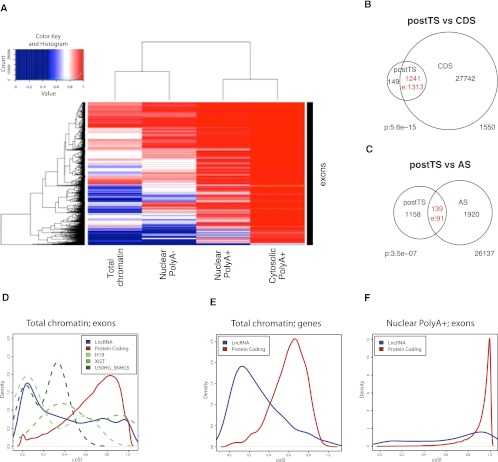
Splicing remains an incompletely understood process. Recent findings suggest that chromatin structure participates in its regulation. Here, we analyze the RNA from subcellular fractions obtained through RNA-seq in the cell line K562. We show that in the human genome, splicing occurs predominantly during transcription. We introduce the coSI measure, based on RNA-seq reads mapping to exon junctions and borders, to assess the degree of splicing completion around internal exons. We show that, as expected, splicing is almost fully completed in cytosolic polyA+ RNA. In chromatin-associated RNA (which includes the RNA that is being transcribed), for 5.6% of exons, the removal of the surrounding introns is fully completed, compared with 0.3% of exons for which no intron-removal has occurred. The remaining exons exist as a mixture of spliced and fewer unspliced molecules, with a median coSI of 0.75. Thus, most RNAs undergo splicing while being transcribed: "co-transcriptional splicing." Consistent with co-transcriptional spliceosome assembly and splicing, we have found significant enrichment of spliceosomal snRNAs in chromatin-associated RNA compared with other cellular RNA fractions and other nonspliceosomal snRNAs. CoSI scores decrease along the gene, pointing to a "first transcribed, first spliced" rule, yet more downstream exons carry other characteristics, favoring rapid, co-transcriptional intron removal. Exons with low coSI values, that is, in the process of being spliced, are enriched with chromatin marks, consistent with a role for chromatin in splicing during transcription. For alternative exons and long noncoding RNAs, splicing tends to occur later, and the latter might remain unspliced in some cases.
Figures

Similar articles
-
RNA Polymerase II Phosphorylated on CTD Serine 5 Interacts with the Spliceosome during Co-transcriptional Splicing.Mol Cell. 2018 Oct 18;72(2):369-379.e4. doi: 10.1016/j.molcel.2018.09.004. Mol Cell. 2018. PMID: 30340024 Free PMC article.
-
Long-read sequencing of nascent RNA reveals coupling among RNA processing events.Genome Res. 2018 Jul;28(7):1008-1019. doi: 10.1101/gr.232025.117. Epub 2018 Jun 14. Genome Res. 2018. PMID: 29903723 Free PMC article.
-
Non-sequential and multi-step splicing of the dystrophin transcript.RNA Biol. 2016;13(3):290-305. doi: 10.1080/15476286.2015.1125074. Epub 2015 Dec 15. RNA Biol. 2016. PMID: 26670121 Free PMC article.
-
Molecular roles and function of circular RNAs in eukaryotic cells.Cell Mol Life Sci. 2018 Mar;75(6):1071-1098. doi: 10.1007/s00018-017-2688-5. Epub 2017 Nov 7. Cell Mol Life Sci. 2018. PMID: 29116363 Free PMC article. Review.
-
Mechanisms and Regulation of Alternative Pre-mRNA Splicing.Annu Rev Biochem. 2015;84:291-323. doi: 10.1146/annurev-biochem-060614-034316. Epub 2015 Mar 12. Annu Rev Biochem. 2015. PMID: 25784052 Free PMC article. Review.
Cited by
-
Native elongating transcript sequencing reveals human transcriptional activity at nucleotide resolution.Cell. 2015 Apr 23;161(3):541-554. doi: 10.1016/j.cell.2015.03.010. Cell. 2015. PMID: 25910208 Free PMC article.
-
CDK12 regulates co-transcriptional splicing and RNA turnover in human cells.iScience. 2022 Aug 28;25(9):105030. doi: 10.1016/j.isci.2022.105030. eCollection 2022 Sep 16. iScience. 2022. PMID: 36111258 Free PMC article.
-
New Insights in RBM20 Cardiomyopathy.Curr Heart Fail Rep. 2020 Oct;17(5):234-246. doi: 10.1007/s11897-020-00475-x. Curr Heart Fail Rep. 2020. PMID: 32789749 Free PMC article. Review.
-
Characterization and comparison of human nuclear and cytosolic editomes.Proc Natl Acad Sci U S A. 2013 Jul 16;110(29):E2741-7. doi: 10.1073/pnas.1218884110. Epub 2013 Jul 1. Proc Natl Acad Sci U S A. 2013. PMID: 23818636 Free PMC article.
-
Long non-coding RNAs: definitions, functions, challenges and recommendations.Nat Rev Mol Cell Biol. 2023 Jun;24(6):430-447. doi: 10.1038/s41580-022-00566-8. Epub 2023 Jan 3. Nat Rev Mol Cell Biol. 2023. PMID: 36596869 Free PMC article. Review.
References
-
- Allo M, Buggiano V, Fededa JP, Petrillo E, Schor I, de la Mata M, Agirre E, Plass M, Eyras E, Elela SA, et al. 2009. Control of alternative splicing through siRNA-mediated transcriptional gene silencing. Nat Struct Mol Biol 16: 717–724 - PubMed
-
- Ameur A, Zaghlool A, Halvardson J, Wetterbom A, Gyllensten U, Cavelier L, Feuk L 2011. Total RNA sequencing reveals nascent transcription and widespread co-transcriptional splicing in the human brain. Nat Struct Mol Biol 18: 1435–1440 - PubMed
-
- Barash YCJ, Gao W, Pan Qu, Wang X, Shai O, Blencowe J, Frey B 2010. Deciphering the splicing code. Nature 465: 53–59 - PubMed
-
- Barski A, Cuddapah S, Cui K, Roh TY, Schones DE, Wang Z, Wei G, Chepelev I, Zhao K 2007. High-resolution profiling of histone methylations in the human genome. Cell 129: 823–837 - PubMed
Publication types
MeSH terms
Substances
Associated data
- Actions
- Actions
Grants and funding
LinkOut - more resources
Full Text Sources
Other Literature Sources
Molecular Biology Databases