. 2012 Sep 6:12:391.
doi: 10.1186/1471-2407-12-391.

TMEM45A is essential for hypoxia-induced chemoresistance in breast and liver cancer cells

Affiliations

TMEM45A is essential for hypoxia-induced chemoresistance in breast and liver cancer cells

Lionel Flamant et al. BMC Cancer. .

Abstract

Background: Hypoxia is a common characteristic of solid tumors associated with reduced response to radio- and chemotherapy, therefore increasing the probability of tumor recurrence. The aim of this study was to identify new mechanisms responsible for hypoxia-induced resistance in breast cancer cells.

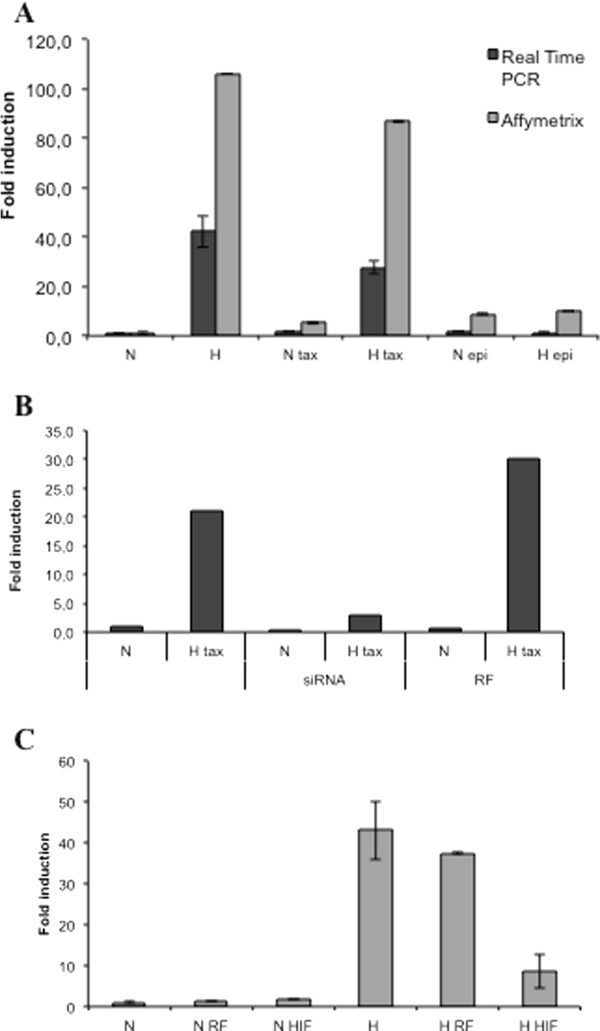
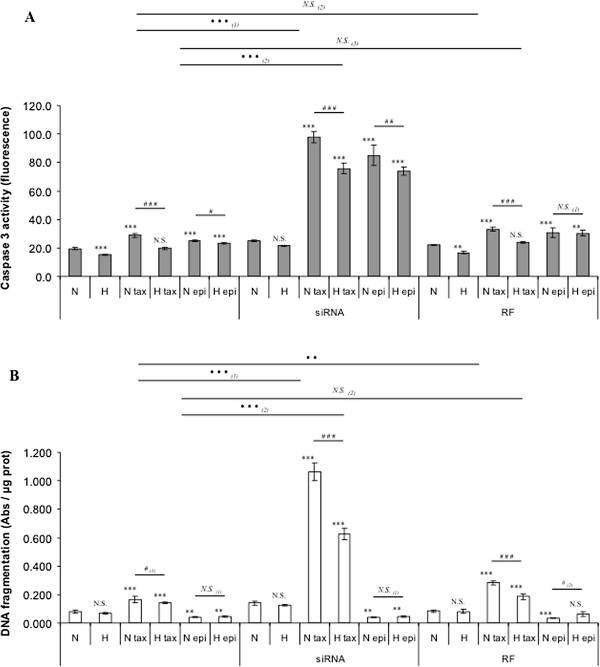
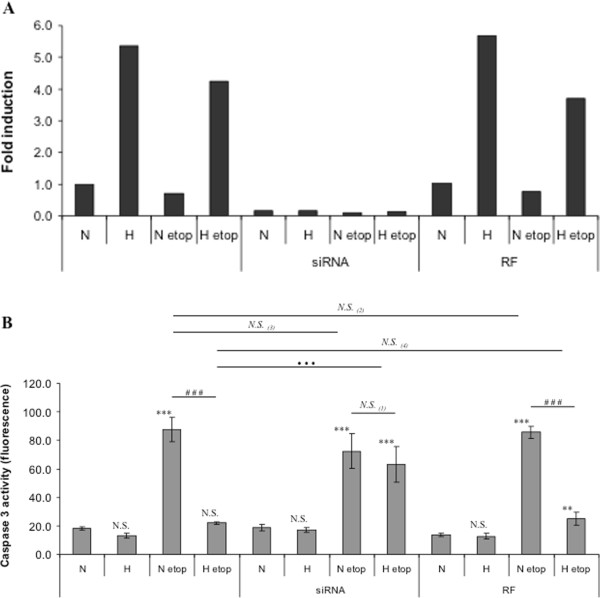
Methods: MDA-MB-231 and HepG2 cells were incubated in the presence of taxol or etoposide respectively under normoxia and hypoxia and apoptosis was analysed. A whole transcriptome analysis was performed in order to identify genes whose expression profile was correlated with apoptosis. The effect of gene invalidation using siRNA was studied on drug-induced apoptosis.

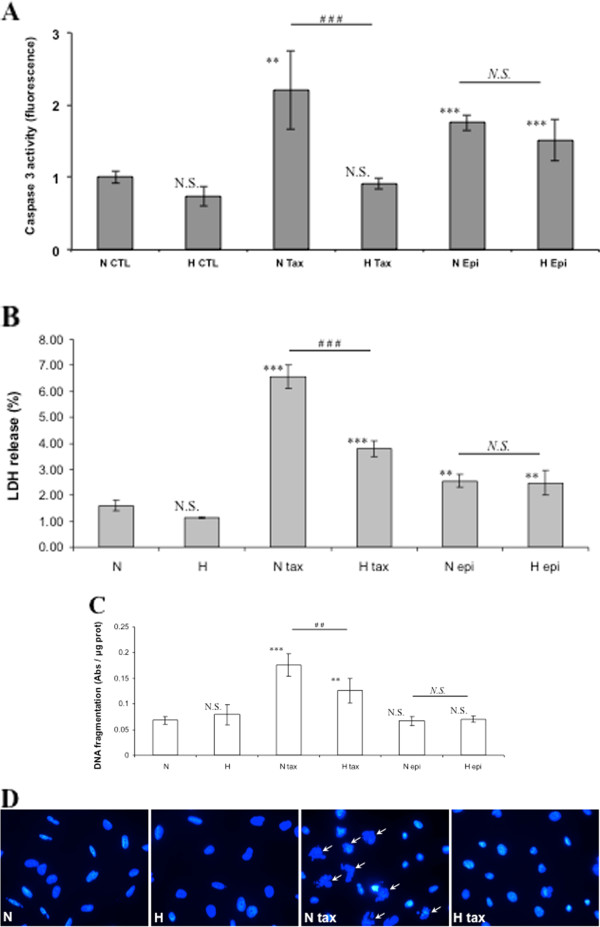
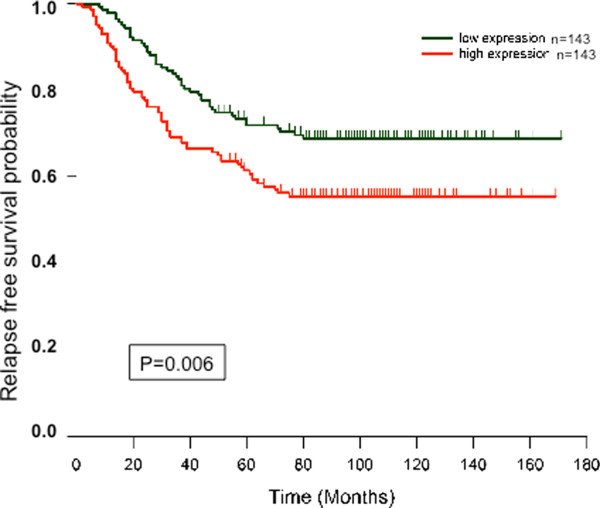
Results: MDA-MB-231 cells incubated in the presence of taxol were protected from apoptosis and cell death by hypoxia. We demonstrated that TMEM45A expression was associated with taxol resistance. TMEM45A expression was increased both in MDA-MB-231 human breast cancer cells and in HepG2 human hepatoma cells in conditions where protection of cells against apoptosis induced by chemotherapeutic agents was observed, i.e. under hypoxia in the presence of taxol or etoposide. Moreover, this resistance was suppressed by siRNA-mediated silencing of TMEM45A. Kaplan Meier curve showed an association between high TMEM45A expression and poor prognostic in breast cancer patients. Finally, TMEM45 is highly expressed in normal differentiated keratinocytes both in vitro and in vivo, suggesting that this protein is involved in epithelial functions.

Conclusion: Altogether, our results unravel a new mechanism for taxol and etoposide resistance mediated by TMEM45A. High levels of TMEM45A expression in tumors may be indicative of potential resistance to cancer therapy, making TMEM45A an interesting biomarker for resistance.


Figures

Figure 1
Figure 1
Effect of hypoxia on paclitaxel or epirubicin-induced apoptosis and cell death. MDA-MB-231 cells were incubated under normoxic (N) or hypoxic (H) conditions with or without paclitaxel (tax, 50 μM) or epirubicin (epi, 10 μM) for 16 hours. (A) Caspase 3 activity was assayed by measuring free AFC released from the cleavage of the caspase 3 specific substrate Ac-DEVD-AFC. Results are expressed in fluorescence intensity, as mean ± 1 SD (n = 3). (B) After the incubation, LDH release was assessed. Results are expressed as mean ± 1 SD (n = 3). (C) After the incubation, DNA fragmentation was assayed using an ELISA for soluble nucleosomes (Cell Death Detection Elisa, Roche). Results are expressed as mean ± 1 SD (n = 3). (D) Nuclear fragmentation was observed after nuclei labeling with DAPI using non-confocal fluorescent microscope (40x magnification). Fragmented nuclei are pointed by arrows. N.S. = non significantly different from control, ** = significantly different from control (p < 0.01), *** = significantly different from control (p < 0.001) ; N.S. = no significant difference between N epi and H epi, ## = significant difference between N tax and H tax (p < 0.01). ### = significant difference between N tax and H tax (p < 0.001).
Figure 2
Figure 2
Analysis of TMEM45A gene expression level obtained with real time PCR and Affymetrix microarrays and effect of TMEM45A silencing on TMEM45A expression. (A) For Affymetrix microarray results: cells were incubated under normoxic (N) or hypoxic (H) conditions with or without paclitaxel (tax, 50 μM) or epirubicin (epi, 10 μM) for 16 hours before total RNA extraction. Results are expressed as mean ratios indicating a fold-increase or decrease in gene expression by comparison with the reference condition (normoxia) ± 1 SD (n = 3). For Real Time PCR results: after incubation, total RNA has been extracted and retro-transcribed in cDNA. A real time PCR has been performed with specific primers for TMEM45A and for RPL13A, a house-keeping gene. Results are expressed as mean of induction level by comparison with the reference condition (normoxia) ± 1 SD (n = 3). (B) Effect of TMEM45A silencing on TMEM45A expression. MDA-MB-231 cells were transfected 24 h with TMEM45A siRNA (siRNA) or RISC-free control siRNA (RF) (50 nM). Cells were then incubated in normoxia or hypoxia with paclitaxel (tax, 50 μM) for 16 hours. TMEM45A mRNA expression was quantified by real-time RT-PCR using RPL13A as the house-keeping gene. Results are expressed in induction level by comparison with the reference condition, normoxia. (C) Effect of HIF-1α silencing on TMEM45A expression. MDA-MB-231 cells were transfected 24 h with HIF1A siRNA (HIF) or RISC-free control siRNA (RF) (50 nM). Cells were then incubated in normoxia or hypoxia for 16 hours. TMEM45A mRNA expression was quantified by real-time RT-PCR using RPL13A as the house-keeping gene. Results are expressed in induction level by comparison with the reference condition, normoxia, as means ± 1 SD (n = 3).
Figure 3
Figure 3
Effect of TMEM45A silencing on the protective effect of hypoxia on paclitaxel-induced apoptosis. 8 h post transfection with TMEM45A siRNA (siRNA) or RISC-free control siRNA (RF) (50 nM, 24 h), MDA-MB-231 cells were incubated under normoxic (N) or hypoxic (H) conditions with or without paclitaxel (tax, 50 μM) or epirubicin (epi, 10 μM) for 16 hours. (A) After transfection and incubation, caspase 3 activity was assayed by measuring free AFC released from the cleavage of the caspase 3 specific substrate Ac-DEVD-AFC. Results are expressed in fluorescence intensity, as mean ± 1 SD (n = 3). (B) After the incubation, DNA fragmentation was assayed using an ELISA for soluble nucleosomes (Cell Death Detection Elisa, Roche). Results are expressed as mean ± 1 SD (n = 3). Statistical analyses were determined independently for the 3 subgroups without siRNA, with anti-TMEM45A siRNA (siRNA) and with RISC-free control siRNA (RF) ; N.S. = non significantly different from control (N, N siRNA or N RF), ** = significantly different from control (p < 0.01), *** = significantly different from control (p < 0.001) ; N.S.(1) = no significant difference between N epi and H epi, #, ### = significant difference between (1) N tax and H tax or (2) N epi and H epi (p < 0.05 ; <0.001), N.S. (2) = no significant difference between H tax and H tax RF, ·· = significant difference between N tax and N tax RF (p < 0.01), ··· = significant difference between (1) N tax and N tax siRNA or (2) H tax and H tax siRNA (p < 0.001).
Figure 4
Figure 4
Analysis of TMEM45A gene expression level and effect of TMEM45A silencing on TMEM45A expression and caspase 3 activity in HepG2 cells. HepG2 cells were incubated under normoxic (N) or hypoxic (H) conditions with or without etoposide (etop, 50 μM) for 16 hours, 8 h post transfection with TMEM45A siRNA (siRNA) or RISC-free control siRNA (RF) (50 nM, 24 h). (A) After transfection and incubation, total RNA has been extracted and retro-transcribed in cDNA. A real time PCR has been performed with specific primers for TMEM45A and for RPL13A, a house-keeping gene. Results are expressed in induction level by comparison with the reference condition, normoxia. (B) After transfection and incubation, caspase 3 activity was assayed by measuring free AFC released from the cleavage of the caspase 3 specific substrate Ac-DEVD-AFC. Results are expressed in fluorescence intensity, as mean ± 1 SD (n = 3). Statistical analyses were determined independently for the 3 subgroups without siRNA, with TMEM45A siRNA (siRNA) and with RISC-free control siRNA (RF) ; N.S. = non significantly different from control (N, N siRNA or N RF), ** = significantly different from control (p < 0.01), *** = significantly different from control (p < 0.001) ; N.S.(1) = no significant difference between N etop and H etop, ### = significant difference between N etop and H etop (p < 0.001), N.S. = no significant difference between (2) N etop and N etop RF, (3) N etop and N etop siRNA, or (4) H etop and H etop RF, ··· = significant difference between H etop and H etop siRNA (p < 0.001).
Figure 5
Figure 5
Kaplan-Meier probability of relapse-free survival for 286 patients with lymph-node-negative breast cancer allocated to one of two subgroups stratified by TMEM45A expression.
Figure 6
Figure 6
Analysis of TMEM45A gene expression level in normal human keratinocytes in vitro and in vivo. (A and B) Keratinocytes were cultured in autocrine conditions (C-2d, 2 days before culture confluence; C, confluence; C + 2d, 2 days after confluence; C + 4d, 4 days after confluence). (A) Total RNA has been extracted and retro-transcribed into cDNA. A real time PCR has been performed with specific primers for TMEM45A and for TBP and RPL0 for normalization. Results are expressed as induction level by comparison with the reference condition “C-2d”. Results are expressed as means ± 1 SD for n = 3, keratinocytes obtained from three different normal donors. ** = significantly different from C-2d (p < 0.01). (B) TMEM45A protein level was assessed by western blot analysis. RPL13a was used as the loading control. (C) Keratinocytes were cultured at low density in the presence of low (0.06 mM) or high (1.5 mM) calcium concentration for 48 hours. Total RNA has been extracted and retro-transcribed into cDNA. A real time PCR has been performed with specific primers for TMEM45A and for TBP and RPL0 for normalization. Results are expressed as induction level by comparison with undifferentiated cells (0.06 mM calcium). Results are expressed as means ± 1 SD for n = 3, keratinocytes obtained from three different normal donors. *** = significantly different from low calcium concentration ((p < 0.001, paired Student’s t test). (D) Immunohistological staining for TMEM45 in sections of human normal skin section with (b and c) or without primary antibody (a).

Similar articles

Cited by

References

    1. Farrell A. A close look at cancer. Nat Med. 2011;17(3):262–265. doi: 10.1038/nm0311-262. - DOI - PubMed
    1. Michael M, Doherty MM. Tumoral drug metabolism: overview and its implications for cancer therapy. J Clin Oncol. 2005;23(1):205–229. - PubMed
    1. Gillet JP, Efferth T, Remacle J. Chemotherapy-induced resistance by ATP-binding cassette transporter genes. Biochim Biophys Acta. 2007;1775(2):237–262. - PubMed
    1. Lage H. An overview of cancer multidrug resistance: a still unsolved problem. Cell Mol Life Sci. 2008;65(20):3145–3167. doi: 10.1007/s00018-008-8111-5. - DOI - PMC - PubMed
    1. Szakacs G, Paterson JK, Ludwig JA, Booth-Genthe C, Gottesman MM. Targeting multidrug resistance in cancer. Nat Rev. 2006;5(3):219–234. doi: 10.1038/nrd1984. - DOI - PubMed

Publication types

MeSH terms