Effect of maraviroc on HIV disease progression-related biomarkers
- PMID: 22948867
- PMCID: PMC3486555
- DOI: 10.1128/AAC.01406-12
Effect of maraviroc on HIV disease progression-related biomarkers
Abstract
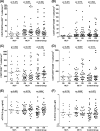
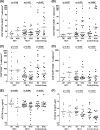
The potential effect of blocking the CCR5 receptor on HIV disease progression biomarkers is not well understood. We showed that an 8-day maraviroc (MVC) monotherapy clinical test (MCT) can be used in selecting patients to receive MVC-containing combined antiretroviral therapy (cART). Using this MCT model, we assessed the effect of MVC on several HIV disease progression biomarkers during the MCT (MVC-specific effect) and following short-term (12-week) cART. We compared 45 patients on MVC monotherapy with a control group of 25 patients on MVC-sparing cART. We found that MVC did not modify any biomarkers in patients that had no virological response after the MCT. MVC-specific effects in patients with virological responses included increased CD8(+) T-cell activation and senescence levels, preservation of an increase in soluble CD14 (sCD14), and a decrease in D dimer levels. After 12 weeks, MVC-containing cART increased CD8(+) T-cell counts and preserved CD4(+) T-cell senescence levels compared with MVC-sparing cART. Moreover, there was a decrease in sCD14 levels in patients that received MVC-containing cART. In conclusion, effects compatible with CD8(+) T-cell redistribution in peripheral blood were observed after MVC therapy. However, MVC was associated with a favorable profile in HIV disease progression biomarkers only in patients with a virological response. These results support a potential clinical benefit of a therapy which includes MVC in HIV-infected patients.
Figures


Similar articles
-
Maraviroc Intensification of cART in Patients with Suboptimal Immunological Recovery: A 48-Week, Placebo-Controlled Randomized Trial.PLoS One. 2015 Jul 24;10(7):e0132430. doi: 10.1371/journal.pone.0132430. eCollection 2015. PLoS One. 2015. PMID: 26208341 Free PMC article. Clinical Trial.
-
T-cell changes after a short-term exposure to maraviroc in HIV-infected patients are related to antiviral activity.J Infect. 2012 Apr;64(4):417-23. doi: 10.1016/j.jinf.2011.12.017. Epub 2011 Dec 29. J Infect. 2012. PMID: 22227467 Clinical Trial.
-
Intensification of antiretroviral therapy with a CCR5 antagonist in patients with chronic HIV-1 infection: effect on T cells latently infected.PLoS One. 2011;6(12):e27864. doi: 10.1371/journal.pone.0027864. Epub 2011 Dec 8. PLoS One. 2011. PMID: 22174752 Free PMC article. Clinical Trial.
-
Maraviroc: a review of its use in the management of CCR5-tropic HIV-1 infection.Drugs. 2010 Jun 18;70(9):1189-213. doi: 10.2165/11203940-000000000-00000. Drugs. 2010. PMID: 20518583 Review.
-
Clinical utility of maraviroc.Clin Drug Investig. 2011;31(8):527-542. doi: 10.2165/11590700-000000000-00000. Clin Drug Investig. 2011. PMID: 21595497 Review.
Cited by
-
Effect of maraviroc intensification on HIV-1-specific T cell immunity in recently HIV-1-infected individuals.PLoS One. 2014 Jan 27;9(1):e87334. doi: 10.1371/journal.pone.0087334. eCollection 2014. PLoS One. 2014. PMID: 24475275 Free PMC article. Clinical Trial.
-
Increased CD127+ and decreased CD57+ T cell expression levels in HIV-infected patients on NRTI-sparing regimens.J Transl Med. 2017 Dec 20;15(1):259. doi: 10.1186/s12967-017-1367-5. J Transl Med. 2017. PMID: 29262860 Free PMC article.
-
CCR5 blockade for neuroinflammatory diseases--beyond control of HIV.Nat Rev Neurol. 2016 Feb;12(2):95-105. doi: 10.1038/nrneurol.2015.248. Epub 2016 Jan 18. Nat Rev Neurol. 2016. PMID: 26782333 Review.
-
Elevated plasma soluble CD14 and skewed CD16+ monocyte distribution persist despite normalisation of soluble CD163 and CXCL10 by effective HIV therapy: a changing paradigm for routine HIV laboratory monitoring?PLoS One. 2014 Dec 29;9(12):e115226. doi: 10.1371/journal.pone.0115226. eCollection 2014. PLoS One. 2014. PMID: 25544986 Free PMC article.
-
Improved CD4 T cell profile in HIV-infected subjects on maraviroc-containing therapy is associated with better responsiveness to HBV vaccination.J Transl Med. 2018 Aug 29;16(1):238. doi: 10.1186/s12967-018-1617-1. J Transl Med. 2018. PMID: 30157873 Free PMC article.
References
-
- Asmuth DM, et al. 2010. CD4+ T-cell restoration after 48 weeks in the maraviroc treatment-experienced trials MOTIVATE 1 and 2. J. Acquir. Immune Defic. Syndr. 54:394–397 - PubMed
-
- Badley AD, et al. 1999. Dynamic correlation of apoptosis and immune activation during treatment of HIV infection. Cell Death Differ. 6:420–432 - PubMed
Publication types
MeSH terms
Substances
LinkOut - more resources
Full Text Sources
Medical
Research Materials

