. 2012:3:1045.
doi: 10.1038/ncomms2046.

Efficacy of the β₂-adrenergic receptor is determined by conformational equilibrium in the transmembrane region

Affiliations
Free PMC article

Efficacy of the β₂-adrenergic receptor is determined by conformational equilibrium in the transmembrane region

Yutaka Kofuku et al. Nat Commun. 2012.
Free PMC article

Abstract

Many drugs that target G-protein-coupled receptors (GPCRs) induce or inhibit their signal transduction with different strengths, which affect their therapeutic properties. However, the mechanism underlying the differences in the signalling levels is still not clear, although several structures of GPCRs complexed with ligands determined by X-ray crystallography are available. Here we utilized NMR to monitor the signals from the methionine residue at position 82 in neutral antagonist- and partial agonist-bound states of β(2)-adrenergic receptor (β(2)AR), which are correlated with the conformational changes of the transmembrane regions upon activation. We show that this residue exists in a conformational equilibrium between the inverse agonist-bound states and the full agonist-bound state, and the population of the latter reflects the signal transduction level in each ligand-bound state. These findings provide insights into the multi-level signalling of β(2)AR and other GPCRs, including the basal activity, and the mechanism of signal transduction mediated by GPCRs.


Figures
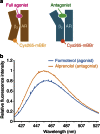
Figure 1
Figure 1. Analyses of ligand-dependent conformational changes in β2AR with fluorescent probes.
(a) Schematic representation of the fluorescent assay. A monobromobimane (mBBr) probe is introduced at C2656.27 of the β2AR without the C265A mutation (orange). After purification, β2AR is in the formoterol-bound state (brown). By the addition of an excess amount of alprenolol (green), formoterol (magenta) is replaced with alprenolol, resulting in β2AR in the alprenolol-bound state (blue). The receptor conformation shift from an active conformation to an inactive conformation was observed as the increase in the fluorescence intensity of mBBr, due to the change in the local environment. (b) Fluorescence spectra of mBBr-labeled β2AR, in the presence of formoterol (cyan), and after the addition of an excess amount of alprenolol (orange). The fluorescence intensities are normalized to the maximal fluorescence intensity in the alprenolol-bound state.
Figure 2
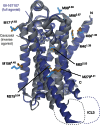
Figure 2. Distribution of the methionine residues in the overlaid crystal structures of β2AR.
The crystal structure of β2AR with an inverse agonist, carazolol (PDB accession code: 2RH1), is shown in grey ribbons. Methionine side chains and carazolol are depicted by cyan and grey sticks, respectively. The crystal structure of β2AR with a full agonist, BI-167107, and a G-protein (PDB accession code: 3SN6) is shown in violet ribbons. Methionine sidechains and BI-167107 are depicted by orange and violet sticks, respectively. These structures are overlaid at TM2, and are shown in a side view with the extracellular sides on the upper sides. ICL3 s, which are either substituted with T4 lysozyme or not observed, are shown with dotted lines.
Figure 3
Figure 3. 1H-13C SOFAST-HMQC spectra of [methyl-13C-Met] β2AR and their assignments.
(a,b) 1H-13C SOFAST-HMQC spectra of [methyl-13C-Met] β2AR in the carazolol-bound state (a) and in the formoterol-bound state (b). (c,d) 1H-13C SOFAST-HMQC spectra of the [methyl-13C-Met] β2AR 4Met mutant in the carazolol-bound state (c) and in the formoterol-bound state (d). (e,f) 1H-13C SOFAST-HMQC spectra of the [methyl-13C-Met] β2AR 4Met/M82V mutant in the carazolol-bound state (e) and in the formoterol-bound state (f). The regions with methionine chemical shifts are shown, and the assigned resonances are indicated. The resonances from M40 in the carazolol-bound state, and M40, M215 and M279 in the formoterol-bound state were not observed. Resonances indicated with single asterisk are derived from minor impurity proteins from insect cell membranes, but not from β2AR. Double asterisks are t1 noises derived from the intense DDM signal with an 1H chemical shift of 1.6–1.7 p.p.m.
Figure 4
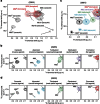
Figure 4. The difference in β2AR M822.53 resonances in the states with various efficacies.
(a) Overlay of the 1H-13C SOFAST-HMQC spectra of [methyl-13C-Met] β2AR/4Met at 298 K in the carazolol-bound state (black) and the formoterol-bound state (red). (b) 1H-13C SOFAST-HMQC spectra of [α,β,β-2H3-, methyl-13C-Met] β2AR/4Met at 298 K in the carazolol-bound (black), alprenolol-bound (cyan), tulobuterol-bound (green), clenbuterol-bound (violet) and formoterol-bound (red) states. Only the regions with M82 resonances are shown. (c) Overlay of the spectra shown in panel b, with the same colors. The centers of the resonances from M82 are indicated with dots. (d) 1H-13C SOFAST-HMQC spectra of [α,β,β-2H3-, methyl-13C-Met] β2AR/4Met at 283 K, with the same colors as in panel b. In panels a–d, the assigned resonances are indicated with the names of the bound ligands in parentheses (a,c). M82 resonances are indicated with the superscripts used in the main text. Resonances indicated with single asterisk are derived from impurities. Double asterisks are t1 noises derived from the intense DDM signal with an 1H chemical shift of 1.6-1.7 p.p.m.
Figure 5
Figure 5. The difference in β2AR M2155.54 or M2796.41 resonances in the states with various efficacies.
(a) 1H-13C SOFAST-HMQC spectra of [α,β,β-2H3-, methyl-13C-Met] β2AR/4Met at 298 K in the carazolol-bound (black), alprenolol-bound (cyan), tulobuterol-bound (green), clenbuterol-bound (violet) and formoterol-bound (red) states. Only regions with M36 and M215 resonances are shown. (b) Overlay of the spectra shown in panel a, except for the formoterol-bound state, with the same colors. In panel b, only the regions with M215 resonances are shown. The centers of the resonances from M215 are indicated with dots. (c) Overlay of the regions with M279 resonances of the 1H-13C SOFAST-HMQC spectra of [α,β,β-2H3-, methyl-13C-Met] β2AR/4Met at 298 K in the carazolol-bound (black), alprenolol-bound (cyan), tulobuterol-bound (green) and clenbuterol-bound (violet) states. The centers of the resonances from M279 are indicated with dots. The line shapes of the M279 resonances are distorted due to the overlaps with the t1 noises derived from the intense DDM signal with an 1H chemical shift of 1.6-1.7 p.p.m.
Figure 6
Figure 6. Normalized chemical shift differences of the methionine methyl resonances between the carazolol- and formoterol-bound states.
Normalized chemical shift differences, Δδ, were calculated by the equation Δδ={(Δδ1H)2+(Δδ13C/3.5)2}0.5. The normalization factor (3.5) is the ratio of the s.d. of the methionine methyl 1H and 13C chemical shifts, deposited in the Biological Magnetic Resonance Data Bank (http://www.bmrb.wisc.edu/). The error values were calculated by the formula {Δδ1H·R1H+Δδ13C·R13C/(3.5)2}/Δδ, where R1H and R13C are the digital resolutions in p.p.m. in the 1H and 13C dimensions, respectively. The number of replicates is greater than two. For M82, both of the Δδs between M82U and M82A (M82U/A), and M82D and M82A (M82D/A) were calculated. For M215 and M279, we could not calculate the Δδs between the carazolol- and formoterol-bound states, because these resonances were not observed in the formoterol-bound state, although Δδs between the carazolol- and clenbuterol-bound states, which should be smaller than those between the carazolol- and formoterol-bound states, were >0.1 p.p.m.
Figure 7
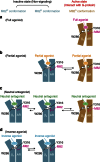
Figure 7. A proposed mechanism for the differences in the efficacy of β2AR for different ligands.
β2AR adopts three conformations with different M822.53 environments; the M82A conformation induces signalling, whereas the M82U and M82D conformations do not. M82U and M82A conformations are largely different on TM5 and TM6, whereas the differences between M82D and M82U conformations are localized in the region close to the ligand-binding site. (a) In the full agonist formoterol-bound state, β2AR adopts mostly the M82A conformation, exhibiting almost full efficacy of β2AR. (b) In the partial agonist clenbuterol- and tulobuterol-bound states, β2AR exists in equilibrium between the M82A and M82U conformations, exhibiting the significant signaling with reduced efficacies. In the tulobuterol-bound state, where the efficacy is lower than that of the clenbuterol-bound state, the populations of the M82U conformation are larger. (c) In the neutral antagonist alprenolol-bound state, β2AR adopts mostly the M82U and M82D conformations, in equilibrium with a small population with the M82A conformation. The presence of the small population with the M82A conformation accounts for the basal activity of β2AR. (d) In the inverse agonist carazolol-bound state, β2AR exists in equilibrium between the M82U and M82D conformations, exhibiting the inhibition of basal activities described in panel c.

Similar articles

Cited by

References

    1. Lagerström M. C. & Schiöth H. B. Structural diversity of G protein-coupled receptors and significance for drug discovery. Nat. Rev. Drug Discov. 7, 339–57 (2008). - PubMed
    1. Overington J. P., Al-Lazikani B. & Hopkins A. L. How many drug targets are there? Nat. Rev. Drug Discov. 5, 993–6 (2006). - PubMed
    1. Kobilka B. K. & Deupi X. Conformational complexity of G-protein-coupled receptors. Trends Pharmacol. Sci. 28, 397–406 (2007). - PubMed
    1. Rosenbaum D. M., Rasmussen S. G. & Kobilka B. K. The structure and function of G-protein-coupled receptors. Nature 459, 356–63 (2009). - PMC - PubMed
    1. Hanania N. A., Dickey B. F. & Bond R. A. Clinical implications of the intrinsic efficacy of β-adrenoceptor drugs in asthma: full, partial and inverse agonism. Curr. Opin. Pulm. Med. 16, 1–5 (2010). - PMC - PubMed

Publication types

MeSH terms

Substances

LinkOut - more resources