

Identifying ChIP-seq enrichment using MACS
- PMID: 22936215
- PMCID: PMC3868217
- DOI: 10.1038/nprot.2012.101
Identifying ChIP-seq enrichment using MACS
Abstract
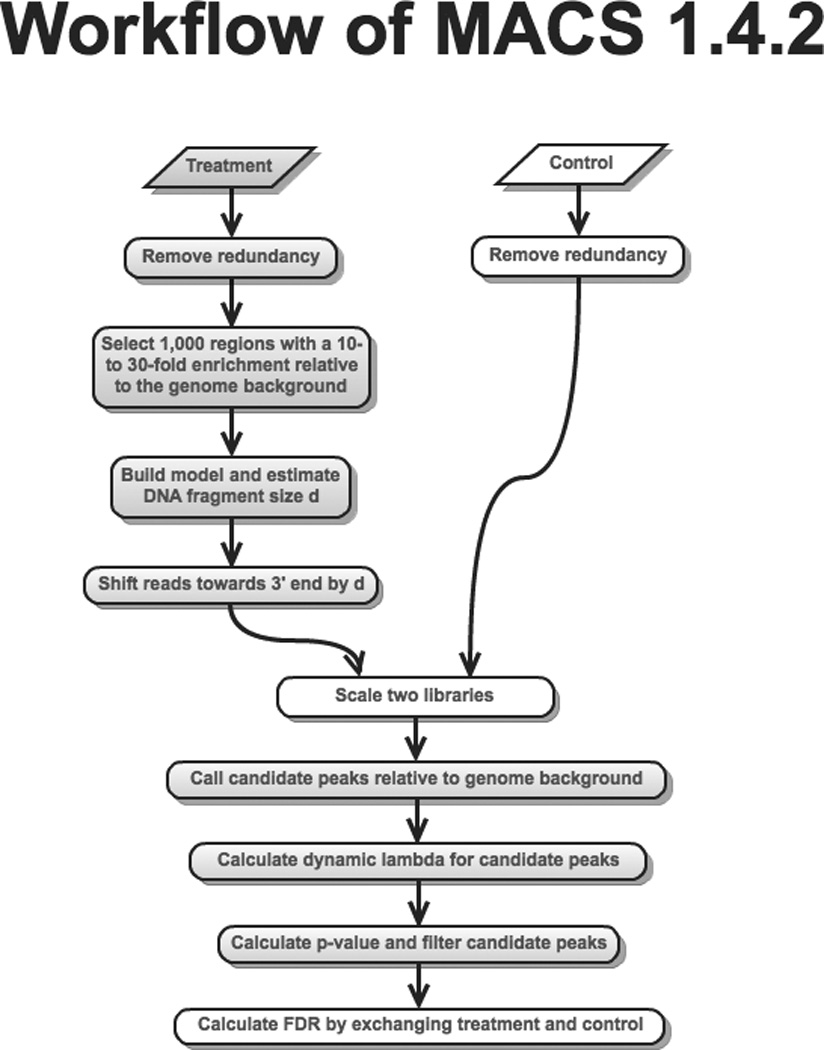
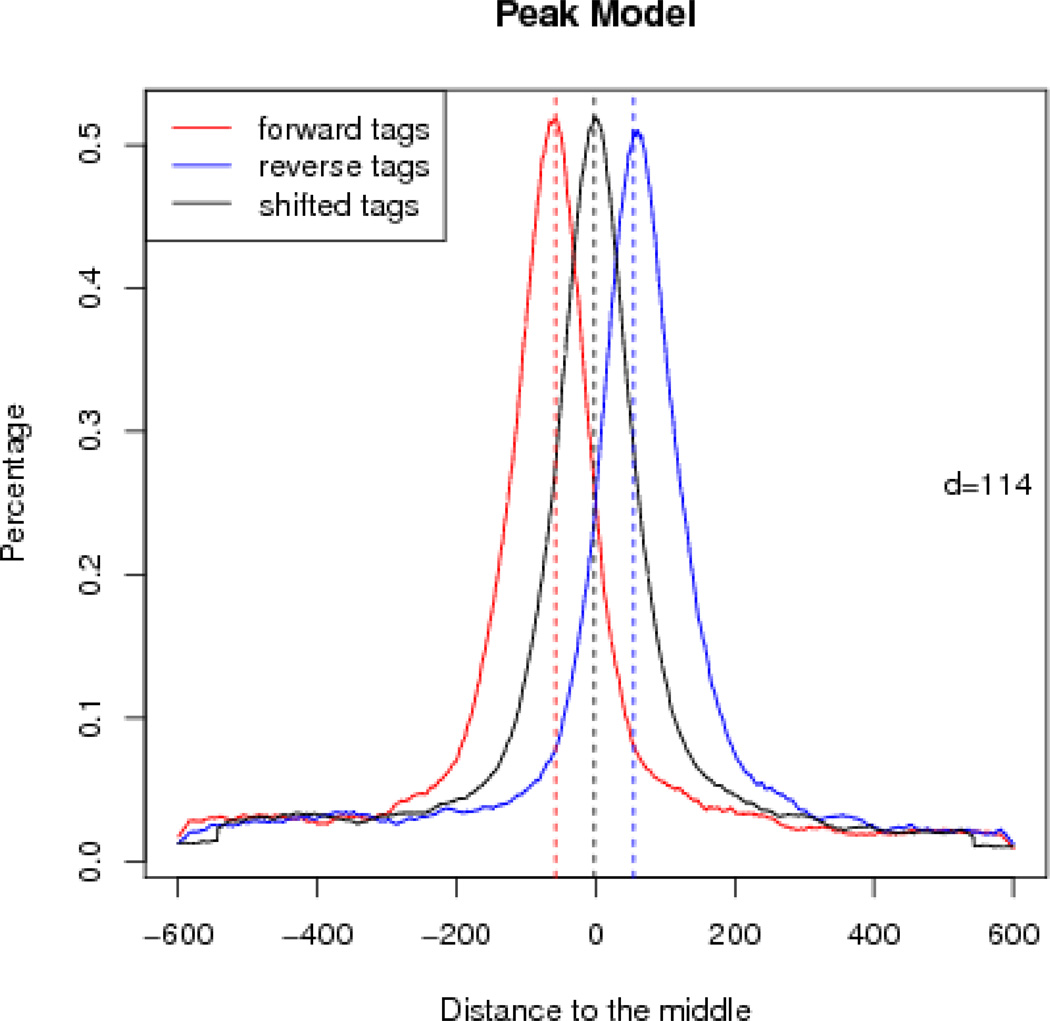
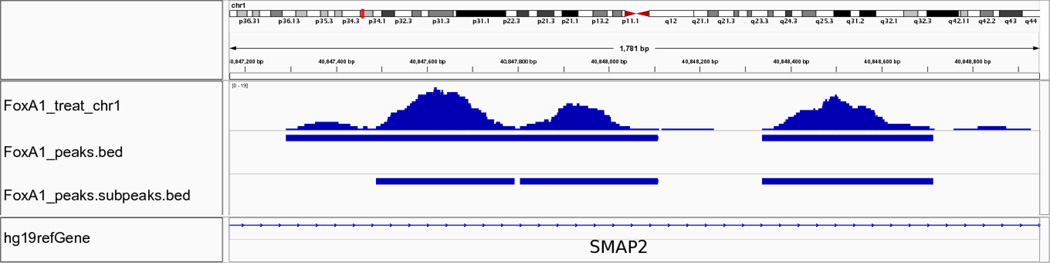
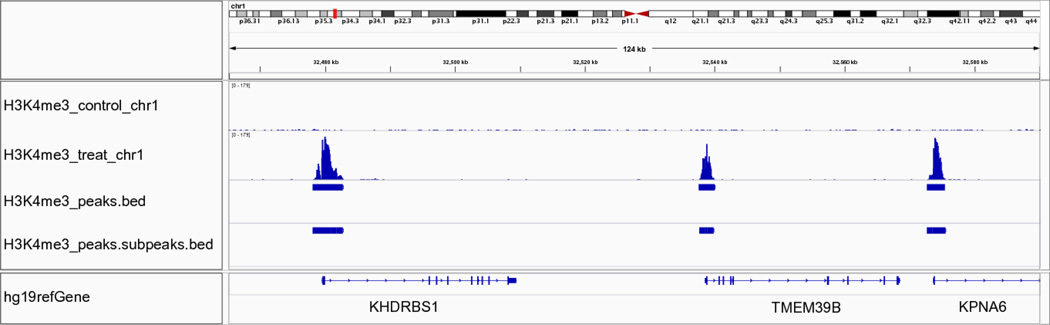
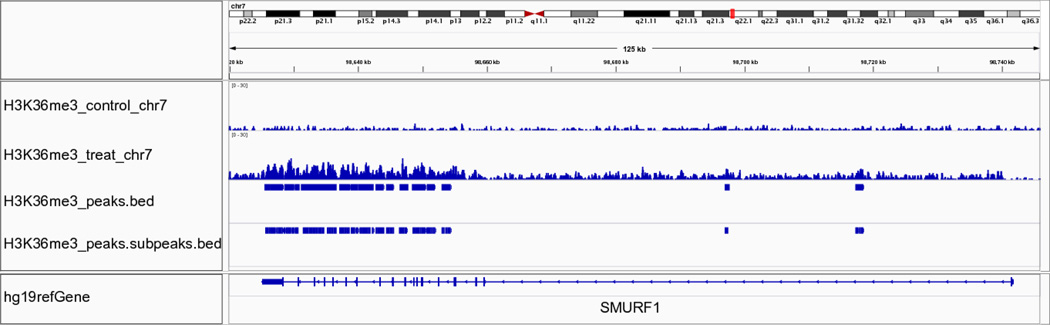
Model-based analysis of ChIP-seq (MACS) is a computational algorithm that identifies genome-wide locations of transcription/chromatin factor binding or histone modification from ChIP-seq data. MACS consists of four steps: removing redundant reads, adjusting read position, calculating peak enrichment and estimating the empirical false discovery rate (FDR). In this protocol, we provide a detailed demonstration of how to install MACS and how to use it to analyze three common types of ChIP-seq data sets with different characteristics: the sequence-specific transcription factor FoxA1, the histone modification mark H3K4me3 with sharp enrichment and the H3K36me3 mark with broad enrichment. We also explain how to interpret and visualize the results of MACS analyses. The algorithm requires ∼3 GB of RAM and 1.5 h of computing time to analyze a ChIP-seq data set containing 30 million reads, an estimate that increases with sequence coverage. MACS is open source and is available from http://liulab.dfci.harvard.edu/MACS/.
Figures
Similar articles
-
Use model-based Analysis of ChIP-Seq (MACS) to analyze short reads generated by sequencing protein-DNA interactions in embryonic stem cells.Methods Mol Biol. 2014;1150:81-95. doi: 10.1007/978-1-4939-0512-6_4. Methods Mol Biol. 2014. PMID: 24743991
-
Model-based analysis of ChIP-Seq (MACS).Genome Biol. 2008;9(9):R137. doi: 10.1186/gb-2008-9-9-r137. Epub 2008 Sep 17. Genome Biol. 2008. PMID: 18798982 Free PMC article.
-
BroadPeak: a novel algorithm for identifying broad peaks in diffuse ChIP-seq datasets.Bioinformatics. 2013 Feb 15;29(4):492-3. doi: 10.1093/bioinformatics/bts722. Epub 2013 Jan 7. Bioinformatics. 2013. PMID: 23300134
-
Role of ChIP-seq in the discovery of transcription factor binding sites, differential gene regulation mechanism, epigenetic marks and beyond.Cell Cycle. 2014;13(18):2847-52. doi: 10.4161/15384101.2014.949201. Cell Cycle. 2014. PMID: 25486472 Free PMC article. Review.
-
Chromatin Immunoprecipitation for Analyzing Transcription Factor Binding and Histone Modifications in Drosophila.Methods Mol Biol. 2016;1478:263-277. doi: 10.1007/978-1-4939-6371-3_16. Methods Mol Biol. 2016. PMID: 27730588 Review.
Cited by
-
Compensatory Effect of the ScGrf3-2R Gene in Semi-Dwarf Spring Triticale (x Triticosecale Wittmack).Plants (Basel). 2022 Nov 9;11(22):3032. doi: 10.3390/plants11223032. Plants (Basel). 2022. PMID: 36432759 Free PMC article.
-
Allelic reprogramming of the histone modification H3K4me3 in early mammalian development.Nature. 2016 Sep 22;537(7621):553-557. doi: 10.1038/nature19361. Epub 2016 Sep 14. Nature. 2016. PMID: 27626382
-
Beyond Trees: Regulons and Regulatory Motif Characterization.Genes (Basel). 2020 Aug 25;11(9):995. doi: 10.3390/genes11090995. Genes (Basel). 2020. PMID: 32854400 Free PMC article. Review.
-
3D chromatin connectivity underlies replication origin efficiency in mouse embryonic stem cells.Nucleic Acids Res. 2022 Nov 28;50(21):12149-12165. doi: 10.1093/nar/gkac1111. Nucleic Acids Res. 2022. PMID: 36453993 Free PMC article.
-
Global dissection of the recombination landscape in soybean using a high-density 600K SoySNP array.Plant Biotechnol J. 2023 Mar;21(3):606-620. doi: 10.1111/pbi.13975. Epub 2022 Dec 19. Plant Biotechnol J. 2023. PMID: 36458856 Free PMC article.
References
-
- Mardis ER. ChIP-seq: welcome to the new frontier. Nat Meth. 2007;4:613–614. - PubMed
-
- Barski A, et al. High-resolution profiling of histone methylations in the human genome. Cell. 2007;129:823–837. - PubMed
-
- Johnson DS, Mortazavi A, Myers RM, Wold B. Genome-wide mapping of in vivo protein-DNA interactions. Science. 2007;316:1497–1502. - PubMed
Publication types
MeSH terms
Substances
Grants and funding
LinkOut - more resources
Full Text Sources
Other Literature Sources
Miscellaneous
