Widespread binding of FUS along nascent RNA regulates alternative splicing in the brain
- PMID: 22934129
- PMCID: PMC3429604
- DOI: 10.1038/srep00603
Widespread binding of FUS along nascent RNA regulates alternative splicing in the brain
Abstract
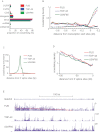
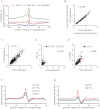
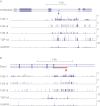
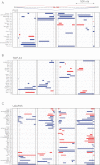
Fused in sarcoma (FUS) and TAR DNA-binding protein 43 (TDP-43) are RNA-binding proteins pathogenetically linked to amyotrophic lateral sclerosis (ALS) and frontotemporal lobar degeneration (FTLD), but it is not known if they regulate the same transcripts. We addressed this question using crosslinking and immunoprecipitation (iCLIP) in mouse brain, which showed that FUS binds along the whole length of the nascent RNA with limited sequence specificity to GGU and related motifs. A saw-tooth binding pattern in long genes demonstrated that FUS remains bound to pre-mRNAs until splicing is completed. Analysis of FUS(-/-) brain demonstrated a role for FUS in alternative splicing, with increased crosslinking of FUS in introns around the repressed exons. We did not observe a significant overlap in the RNA binding sites or the exons regulated by FUS and TDP-43. Nevertheless, we found that both proteins regulate genes that function in neuronal development.
Figures


Similar articles
-
Depressing time: Waiting, melancholia, and the psychoanalytic practice of care.In: Kirtsoglou E, Simpson B, editors. The Time of Anthropology: Studies of Contemporary Chronopolitics. Abingdon: Routledge; 2020. Chapter 5. In: Kirtsoglou E, Simpson B, editors. The Time of Anthropology: Studies of Contemporary Chronopolitics. Abingdon: Routledge; 2020. Chapter 5. PMID: 36137063 Free Books & Documents. Review.
-
An evaluation of a SVA retrotransposon in the FUS promoter as a transcriptional regulator and its association to ALS.PLoS One. 2014 Mar 7;9(6):e90833. doi: 10.1371/journal.pone.0090833. eCollection 2014. PLoS One. 2014. PMID: 24608899 Free PMC article.
-
Using Experience Sampling Methodology to Capture Disclosure Opportunities for Autistic Adults.Autism Adulthood. 2023 Dec 1;5(4):389-400. doi: 10.1089/aut.2022.0090. Epub 2023 Dec 12. Autism Adulthood. 2023. PMID: 38116059 Free PMC article.
-
A Blog-Based Study of Autistic Adults' Experiences of Aloneness and Connection and the Interplay with Well-Being: Corpus-Based and Thematic Analyses.Autism Adulthood. 2023 Dec 1;5(4):437-449. doi: 10.1089/aut.2022.0073. Epub 2023 Dec 12. Autism Adulthood. 2023. PMID: 38116056 Free PMC article.
-
Metformin for endometrial hyperplasia.Cochrane Database Syst Rev. 2024 May 2;5(5):CD012214. doi: 10.1002/14651858.CD012214.pub3. Cochrane Database Syst Rev. 2024. PMID: 38695827 Review.
Cited by
-
A protein assembly mediates Xist localization and gene silencing.Nature. 2020 Nov;587(7832):145-151. doi: 10.1038/s41586-020-2703-0. Epub 2020 Sep 9. Nature. 2020. PMID: 32908311 Free PMC article.
-
A postzygotic de novo NCDN mutation identified in a sporadic FTLD patient results in neurochondrin haploinsufficiency and altered FUS granule dynamics.Acta Neuropathol Commun. 2022 Feb 12;10(1):20. doi: 10.1186/s40478-022-01314-x. Acta Neuropathol Commun. 2022. PMID: 35151370 Free PMC article.
-
Conditional depletion of Fus in oligodendrocytes leads to motor hyperactivity and increased myelin deposition associated with Akt and cholesterol activation.Glia. 2020 Oct;68(10):2040-2056. doi: 10.1002/glia.23825. Epub 2020 Mar 18. Glia. 2020. PMID: 32187401 Free PMC article.
-
m6A Modified Short RNA Fragments Inhibit Cytoplasmic TLS/FUS Aggregation Induced by Hyperosmotic Stress.Int J Mol Sci. 2021 Oct 12;22(20):11014. doi: 10.3390/ijms222011014. Int J Mol Sci. 2021. PMID: 34681673 Free PMC article.
-
ePRINT: exonuclease assisted mapping of protein-RNA interactions.Genome Biol. 2024 May 28;25(1):140. doi: 10.1186/s13059-024-03271-1. Genome Biol. 2024. PMID: 38807229 Free PMC article.
References
-
- Nguyen C. D. et al. Characterization of a family of RanBP2-type zinc fingers that can recognize single-stranded RNA. J Mol Biol 407, 273–283 (2011). - PubMed
-
- Mackenzie I. R., Rademakers R. & Neumann M. TDP-43 and FUS in amyotrophic lateral sclerosis and frontotemporal dementia. Lancet Neurol 9, 995–1007 (2010). - PubMed
Publication types
MeSH terms
Substances
Grants and funding
LinkOut - more resources
Full Text Sources
Molecular Biology Databases
Miscellaneous

