. 2012 Oct 1;189(7):3439-48.
doi: 10.4049/jimmunol.1201168. Epub 2012 Aug 27.

SOCS3 deficiency promotes M1 macrophage polarization and inflammation

Affiliations

SOCS3 deficiency promotes M1 macrophage polarization and inflammation

Hongwei Qin et al. J Immunol. .

Erratum in

Abstract

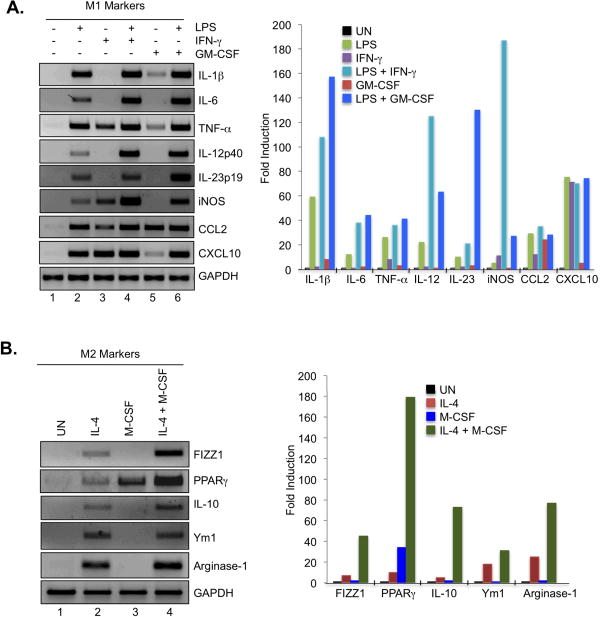
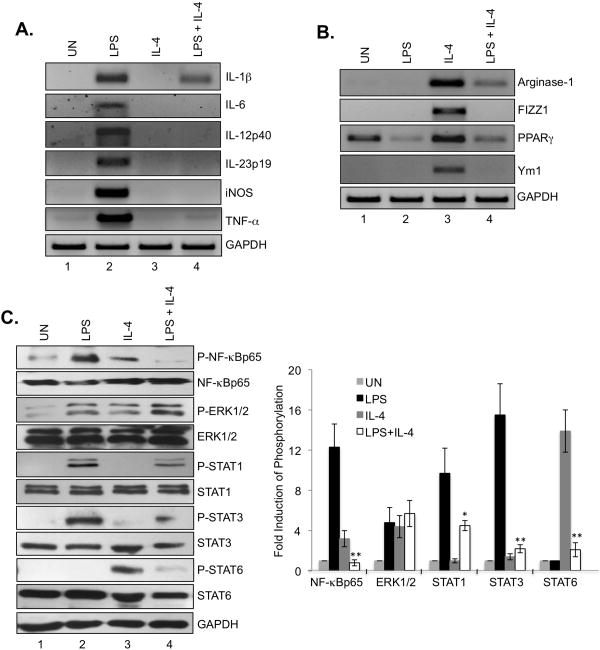
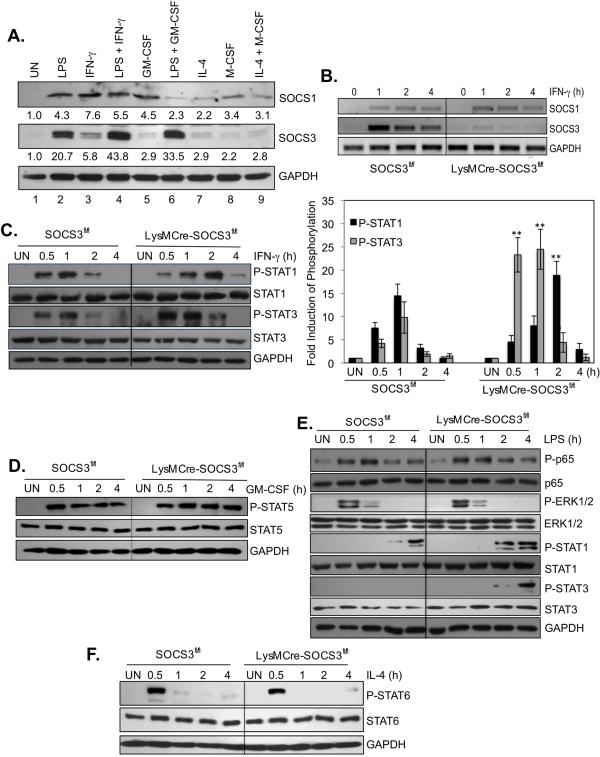
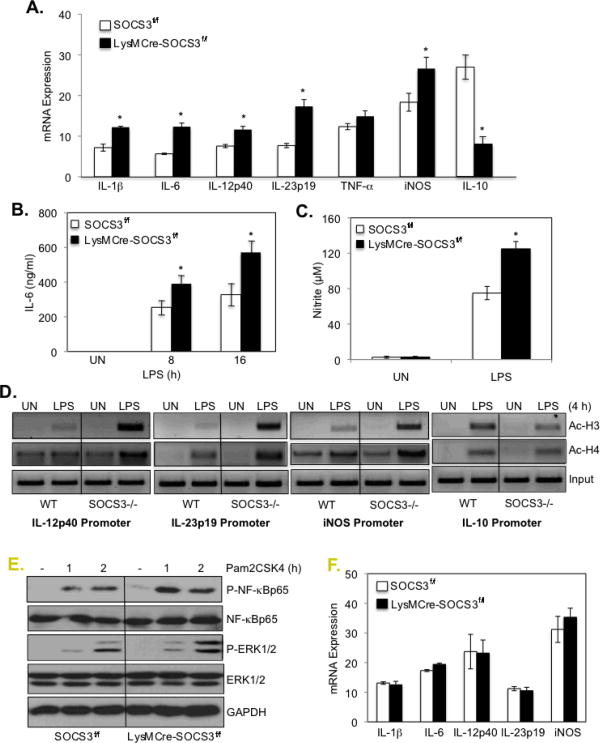
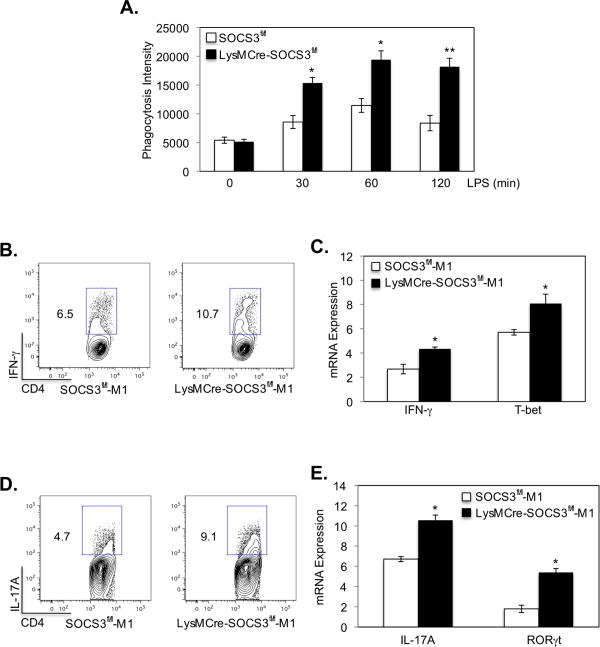
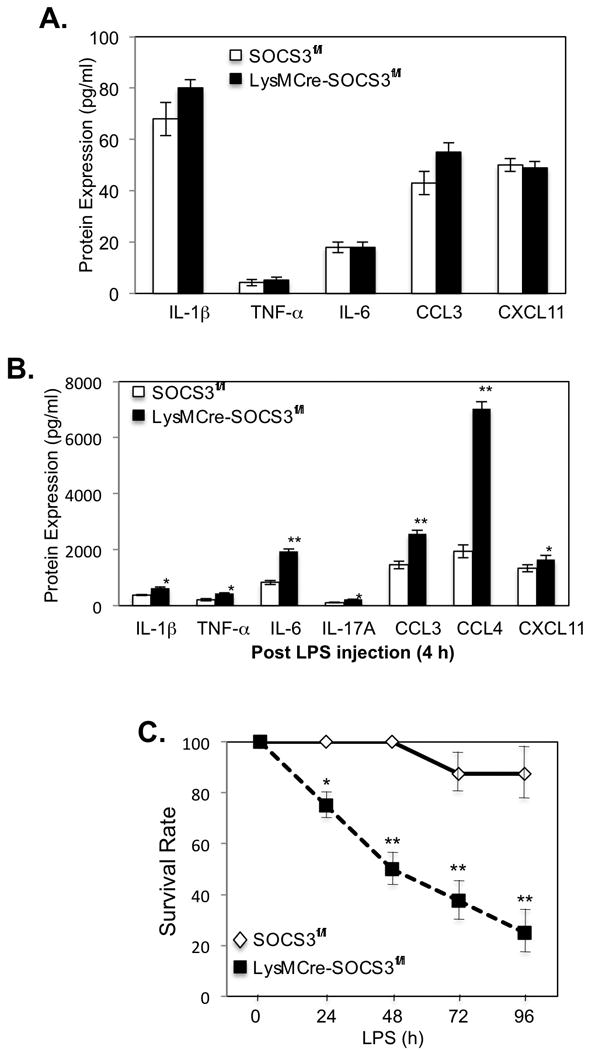
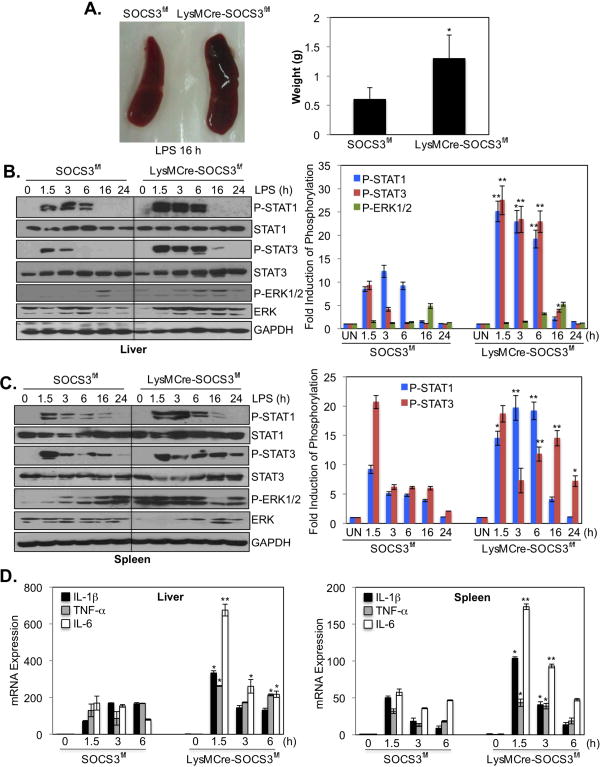
Macrophages participate in both the amplification of inflammation at the time of injury and downregulation of the inflammatory response to avoid excess tissue damage. These divergent functions of macrophages are dictated by their microenvironment, especially cytokines, which promote a spectrum of macrophage phenotypes. The M1 proinflammatory phenotype is induced by LPS, IFN-γ, and GM-CSF, and IL-4, IL-13, and M-CSF induce anti-inflammatory M2 macrophages. Suppressors of cytokine signaling (SOCS) proteins function as feedback inhibitors of the JAK/STAT signaling pathway, and they can terminate innate and adaptive immune responses. In this study, we have evaluated the influence of SOCS3 on macrophage polarization and function. Macrophages obtained from LysMCre-SOCS3(fl/fl) mice, which lack SOCS3 in myeloid lineage cells, exhibit enhanced and prolonged activation of the JAK/STAT pathway compared with macrophages from SOCS3(fl/fl) mice. Furthermore, SOCS3-deficient macrophages have higher levels of the M1 genes IL-1β, IL-6, IL-12, IL-23, and inducible NO synthase owing to enhanced transcriptional activation and chromatin modifications. SOCS3-deficient M1 macrophages also have a stronger capacity to induce Th1 and Th17 cell differentiation than M1 macrophages from SOCS3(fl/fl) mice. Lastly, LPS-induced sepsis is exacerbated in LysMCre-SOCS3(fl/fl) mice and is associated with enhanced STAT1/3 activation and increased plasma levels of M1 cytokines/chemokines such as IL-1β, TNF-α, IL-6, CCL3, CCL4, and CXCL11. These findings collectively indicate that SOCS3 is involved in repressing the M1 proinflammatory phenotype, thereby deactivating inflammatory responses in macrophages.


Figures

Figure 1
Figure 1. M1 and M2 Gene Expression in Macrophages
(A). BMDMs from C57BL/6 mice were cultured with M-CSF (10 ng/ml) for 5 days, and then treated with medium, LPS (10 ng/ml), IFN-γ (10 ng/ml), LPS plus IFN-γ, GM-CSF (50 ng/ml) or LPS plus GM-CSF for 4 h, and mRNA analyzed by RT-PCR for IL-1β, IL-6, TNF-α, IL-12p40, IL-23p19, iNOS, CCL2, CXCL10 and GAPDH expression. Quantification of the data is shown on the right. (B). BMDMs were cultured with M-CSF (10 ng/ml) for 5 days, and then incubated with medium (UN), IL-4 (10 ng/ml), M-CSF (10 ng/ml) or IL-4 plus M-CSF for 4 h, and mRNA analyzed by RT-PCR for FIZZ1, PPAR-γ, IL-10, Ym1, Arginase-1 and GAPDH expression. Quantification of the data is shown on the right. Representative of three independent experiments.
Figure 2
Figure 2. Plasticity of M1 and M2 Macrophage Phenotype Upon LPS and IL-4 Stimulation
(A). BMDMs were cultured with M-CSF (10 ng/ml) for 5 days, treated with LPS, IL-4 or LPS plus IL-4 for 4 h, and then mRNA analyzed by RT-PCR for IL-1β, IL-6, IL-12p40, IL-23p19, iNOS, TNF-α and GAPDH expression. (B). BMDMs were cultured with M-CSF (10 ng/ml) for 5 days, treated with LPS, IL-4 or LPS plus IL-4 for 4 h, and then mRNA analyzed by RT-PCR for Arginase-1, FIZZ1, PPAR-γ, Ym1 and GAPDH expression. (C). BMDMs were cultured with M-CSF (10 ng/ml) for 5 days, treated with LPS, IL-4 or LPS plus IL-4 for 4 h, and then protein lysates analyzed by immunoblotting with the specified antibodies. The densitometric quantification of P-NF-κBp65, P-ERK1/ERK2, P-STAT1, P-STAT3 and P-STAT6 was determined using an image analysis program (ImageJ 1.41oh) by comparing to untreated samples. *p<0.05; **p<0.001. Represents three independent experiments.
Figure 3
Figure 3. Absence of SOCS3 Enhances STAT Activation in Macrophages
(A). BMDMs were treated with LPS, IFN-γ, LPS plus IFN-γ, GM-CSF, LPS plus GM-CSF, IL-4, M-CSF or IL-4 plus M-CSF for 4 h, and then cell lysates were analyzed by immunoblotting with SOCS1, SOCS3 and GAPDH Abs. (B). BMDMs from SOCS3fl/fl and LysMCre-SOCS3fl/fl mice were cultured with M-CSF (10 ng/ml) for 5 days, treated with IFN-γ for up to 4 h, and then mRNA analyzed by RT-PCR for SOCS1, SOCS3 and GAPDH expression. BMDMs were cultured with M-CSF (10 ng/ml) for 5 days, treated with IFN-γ (C)., GM-CSF (D)., LPS (E)., or IL-4 (F). for up to 4 h, and then protein lysates analyzed by immunoblotting with the specified Abs. Represents five independent experiments. **p<0.001.
Figure 4
Figure 4. SOCS3 Deletion in Macrophages Leads to Enhanced M1 Polarization
(A). BMDMs from SOCS3fl/fl and LysMCre-SOCS3fl/fl mice were treated with medium or LPS for 4 h. mRNA was analyzed by qRT-PCR for IL-1β, IL-6, IL-12p40, IL-23p19, TNF-α, iNOS, IL-10 and GAPDH expression. (B). BMDMs were treated with medium (UN) or LPS for up to 16 h, and supernatants were analyzed for IL-6 protein by ELISA. (C). BMDMs from SOCS3fl/fl and LysMCre-SOCS3fl/fl mice were treated with medium (UN) or LPS for 24 h. Supernatants were analyzed for production of nitrite, a stable end product of NO production, using the Griess reagent. *p<0.05. (D). BMDMs were treated with medium (UN) or LPS for 4 h, and then cells were cross-linked with formaldehyde. Soluble chromatin was subjected to immunoprecipitation with Abs against histone acetylation (Ac-H3 and Ac-H4) or normal rabbit IgG. PCR analysis of the positive control (input) indicates that soluble chromatin samples obtained from each time point had equal amounts of chromatin fragments containing the IL-12p40, IL-23p19, iNOS and IL-10 promoters. (E). BMDMs from SOCS3fl/fl and LysMCre-SOCS3fl/fl mice were treated with Pam2CSK4 (10 ng/ml) for 1 and 2 h, then protein lysates analyzed by immunoblotting with the specified Abs. (F). BMDMs from SOCS3fl/fl and LysMCre-SOCS3fl/fl mice were treated with Pam2CSK4 (10 ng/ml) for 4 h. mRNA was analyzed by qRT-PCR for IL-1β, IL-6, IL-12p40, IL-23p19, iNOS and GAPDH expression. Represents three independent experiments.
Figure 5
Figure 5. Myeloid SOCS3 Influences Phagocytosis and Th1-Th17 Differentiation
(A). Macrophages from SOCS3fl/fl and LysMCre-SOCS3fl/fl mice were polarized to the M1 phenotype with LPS for 48 h, and phagocytosis was assessed using the pHrodo™ E. coli BioParticles® Phagocytosis Kit for Flow Cytometry. *p<0.05. (B-E). LPS plus IFN-γ polarized M1 macrophages were used as antigen-presenting cells and cultured with naive CD4+ T cells isolated from the spleen of OVA-TCR transgenic OTII mice at a 1:5 ratio for Th1 and Th17 cell differentiation. Th1 cells were differentiated with IL-12 (10 ng/ml), anti-IL-4 (10 μg/ml) and OVA peptide (5 μg/ml); and Th17 cells were differentiated with TGF-β (5 ng/ml), IL-6 (20 ng/ml), IL-23 (10 ng/ml), anti-IFN-γ (10 μg/ml), anti-IL-4 (10 μg/ml) and OVA peptide (5 μg/ml). At day 4, cells were stimulated with PMA/Ionomycin plus GolgiStop for 4 h, stained for the surface marker CD4 and by intracellular flow for IFN-γ protein (B)., for IFN-γ and T-bet mRNA expression by qRT-PCR (C)., by intracellular flow for IL-17A protein (D)., or for IL-17A and RORγt mRNA expression by qRT-PCR (E). *p<0.05. Represents three independent experiments.
Figure 6
Figure 6. Function of Myeloid SOCS3 in LPS-induced Septic Shock Model
(A). Expression of IL-1β, TNF-α, IL-6, CCL3 and CXCL11 protein in the plasma of SOCS3fl/fl and LysMCre-SOCS3fl/fl mice before LPS administration, as determined by ELISA. (B). Expression of IL-1β, TNF-α, IL-6, IL-17A, CCL3, CCL4 and CXCL11 protein in the plasma of SOCS3fl/fl and LysMCre-SOCS3fl/fl mice 4 h after administration of LPS (2.5 mg/kg body weight), as determined by ELISA. (C). Survival rate of SOCS3fl/fl and LysMCre-SOCS3fl/fl mice (n = 4 per group per experiment) after intraperitoneal (i.p.) injection of LPS (2.5 mg/kg body weight). *p<0.05; **p<0.001. Represents three independent experiments.
Figure 7
Figure 7. Enhanced Activation of STATs and Increased Cytokine/Chemokine Expression in LysMCre-SOCS3fl/fl Mice
(A). Relative size of LysMCre-SOCS3fl/fl (right) spleen compared to SOCS3fl/fl mice (left) after i.p. administration of 2.5 mg/kg of LPS for 16 h. Average spleen weight is represented as mean ± SD (n=3). *p <0.05. (B). SOCS3fl/fl and LysMCre-SOCS3fl/fl mice were administered LPS (2.5 mg/kg), and STAT1, STAT3 and ERK1/2 phosphorylation was measured by immunoblotting in liver lysates at the indicated time points. Quantification of the data is shown on the right. *p<0.05; **p<0.001. (C). Spleen lysates from SOCS3fl/fl and LysMCre-SOCS3fl/fl mice were immunoblotted as in (B) at the indicated time points. Quantification of the data is shown on the right. *p<0.05; **p<0.001. (D). QRT-PCR analysis of IL-1β, TNF-α and IL-6 mRNA expression in liver and spleen tissue from mice after i.p. administration of LPS (2.5 mg/kg) (0-6 h). *p <0.05; **p <0.001 versus data from SOCS3fl/fl mice at the corresponding time points. Represents three independent experiments.

Similar articles

Cited by

References

    1. Lawrence T, Natoli G. Transcriptional regulation of macrophage polarization: enabling diversity with identity. Nat Rev Immunol. 2011;11:750–761. - PubMed
    1. Murray PJ, Wynn TA. Obstacles and opportunities for understanding macrophage polarization. J Leukoc Biol. 2011;89:557–563. - PMC - PubMed
    1. Murray PJ, Wynn TA. Protective and pathogenic functions of macrophage subsets. Nat Rev Immunol. 2011;11:723–737. - PMC - PubMed
    1. Mantovani A, Locati M. Orchestration of macrophage polarization. Blood. 2009;114:3135–3136. - PubMed
    1. Khallou-Laschet J, Varthaman A, Fornasa G, Compain C, Gaston AT, Clement M, Dussiot M, Levillain O, Graff-Dubois S, Nicoletti A, Caligiuri G. Macrophage plasticity in experimental atherosclerosis. PLoS One. 2010;5:e8852. - PMC - PubMed

Publication types

MeSH terms

Substances