. 2012 Sep 15;26(18):2038-49.
doi: 10.1101/gad.198200.112. Epub 2012 Aug 27.

D-2-hydroxyglutarate produced by mutant IDH1 perturbs collagen maturation and basement membrane function

Affiliations

D-2-hydroxyglutarate produced by mutant IDH1 perturbs collagen maturation and basement membrane function

Masato Sasaki et al. Genes Dev. .

Abstract

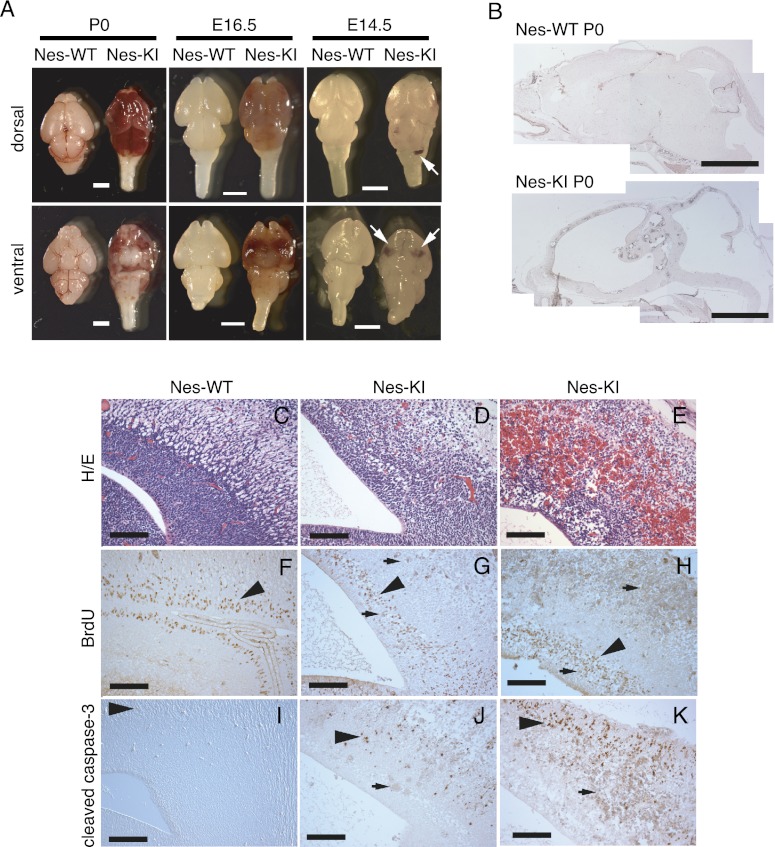
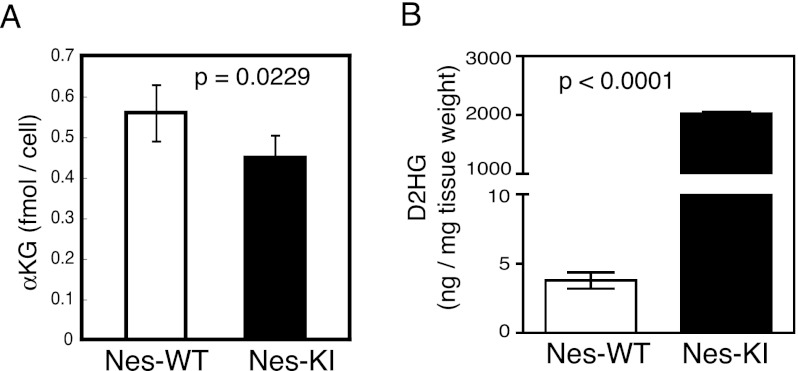
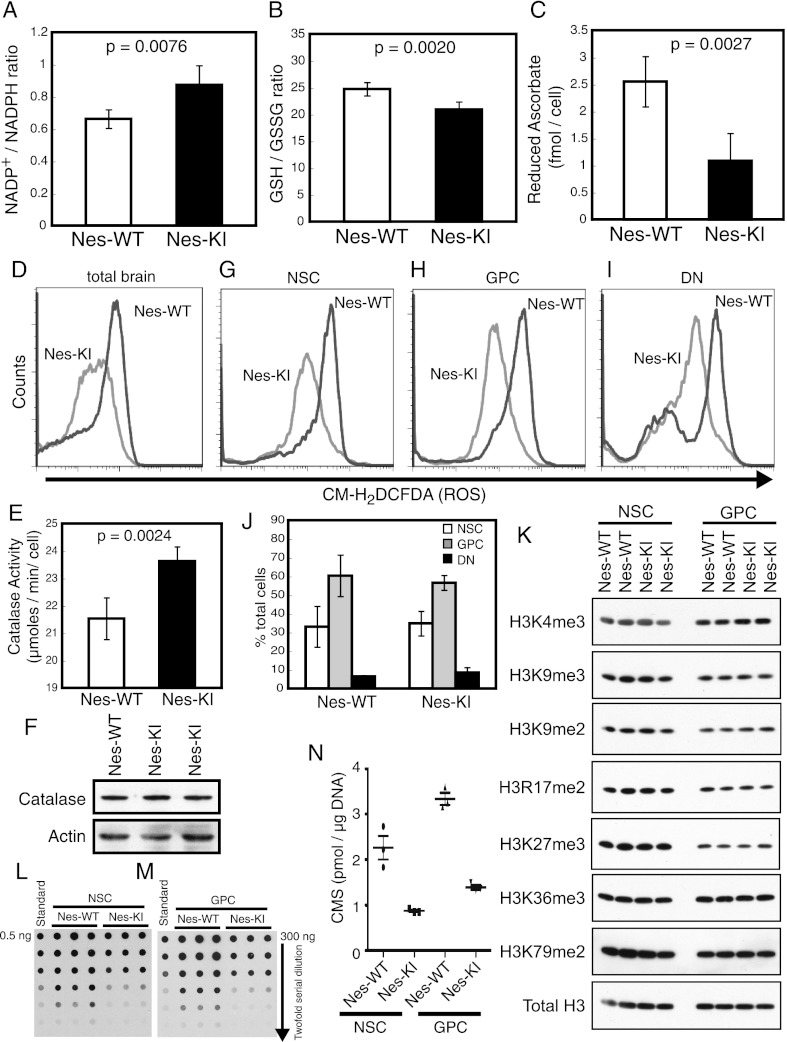
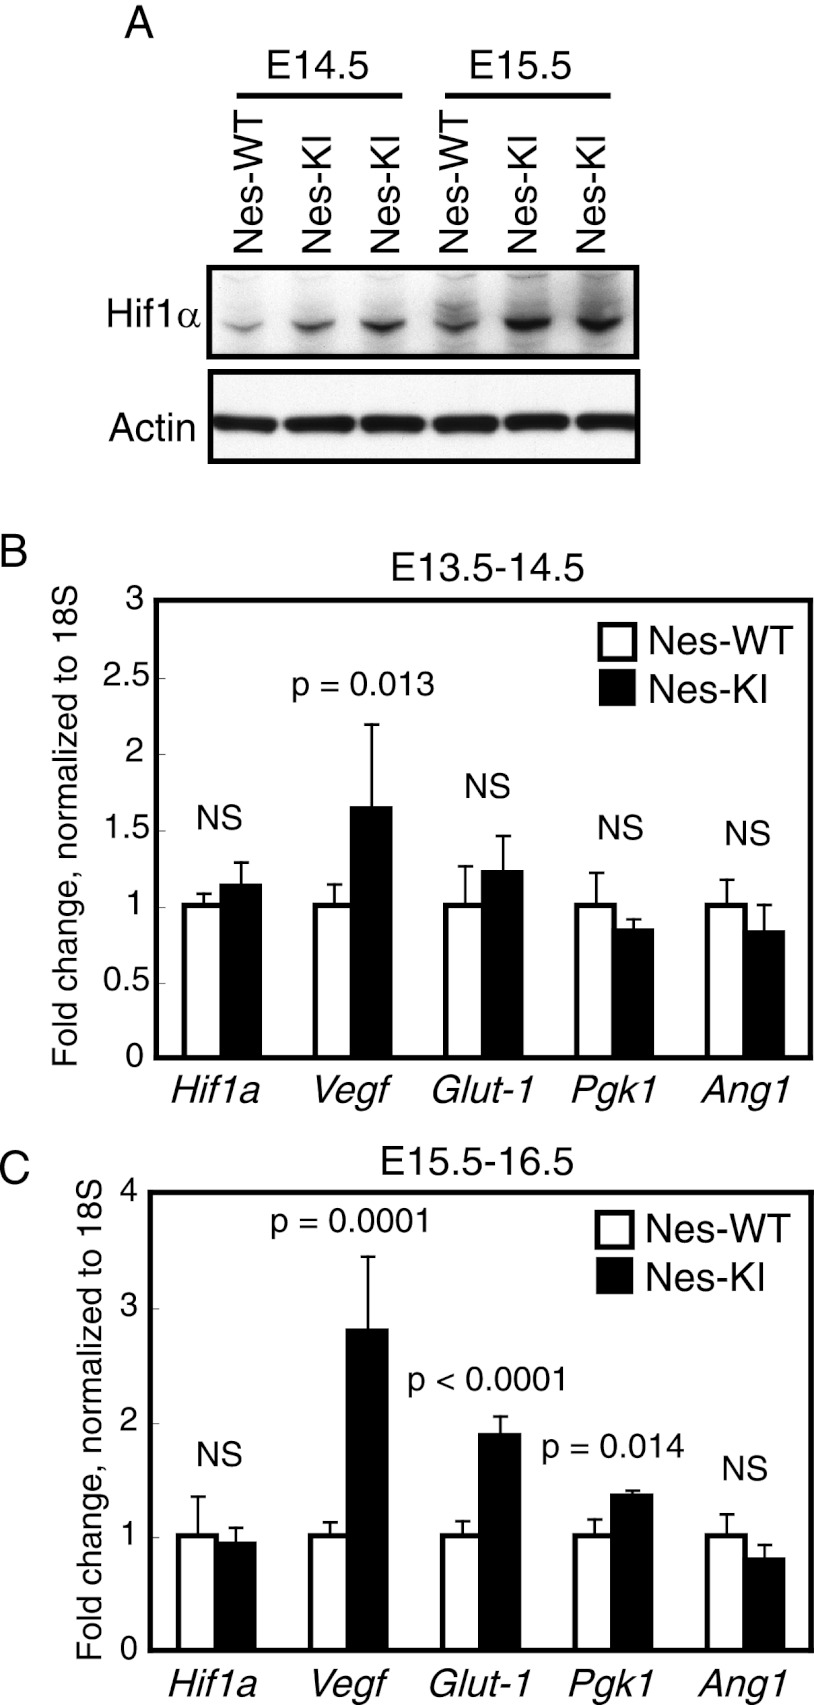
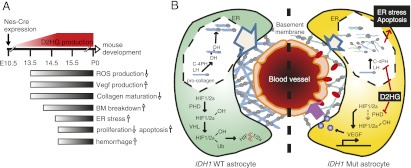
Isocitrate dehydrogenase-1 (IDH1) R132 mutations occur in glioma, but their physiological significance is unknown. Here we describe the generation and characterization of brain-specific Idh1 R132H conditional knock-in (KI) mice. Idh1 mutation results in hemorrhage and perinatal lethality. Surprisingly, intracellular reactive oxygen species (ROS) are attenuated in Idh1-KI brain cells despite an apparent increase in the NADP(+)/NADPH ratio. Idh1-KI cells also show high levels of D-2-hydroxyglutarate (D2HG) that are associated with inhibited prolyl-hydroxylation of hypoxia-inducible transcription factor-1α (Hif1α) and up-regulated Hif1α target gene transcription. Intriguingly, D2HG also blocks prolyl-hydroxylation of collagen, causing a defect in collagen protein maturation. An endoplasmic reticulum (ER) stress response induced by the accumulation of immature collagens may account for the embryonic lethality of these mutants. Importantly, D2HG-mediated impairment of collagen maturation also led to basement membrane (BM) aberrations that could play a part in glioma progression. Our study presents strong in vivo evidence that the D2HG produced by the mutant Idh1 enzyme is responsible for the above effects.


Figures

Figure 1.
Figure 1.
Histological characterization of brains of Nes-Idh1KI/wt (Nes-KI) mice. (A) Dorsal and ventral views of whole brains dissected from Nes-WT (control) or Nes-KI mice at the newborn stage (P0) or at E16.5 or E14.5. Hemorrhage (white arrows) was observed in Nes-KI embryos starting at E14.5. Bars, 2 mm. (B) Sagittal sections of brains of Nes-WT and Nes-KI P0 embryos that were immunostained to detect BrdU. Bars, 2 mm. (C–K) Sagittal sections of the brains of one Nes-WT (C,F,I) and two Nes-KI E15.5 embryos (D,E,G,H,J,K) that were stained with H&E (C–E) or immunostained to detect BrdU (F–H) or cleaved caspase-3 (I–K). Black arrowheads indicate brain cells positive for BrdU or cleaved caspase-3. Small black arrows indicate regions of hemorrhage within the brain. Bars, 100 μm. For AK, results are representative of at least three embryos/group.
Figure 2.
Figure 2.
Altered αKG and D2HG levels correlate with expression of Idh1 R132 protein in mouse brains. (A) Brains of Nes-WT (n = 4) and Nes-KI (n = 6) E14.5 embryos were dissociated to generate single-cell suspensions, and intracellular αKG levels were determined in extracts of 2 × 10⁶ brain cells. (B) Brain tissue extracts from Nes-WT (n = 4) and Nes-KI (n = 5) E13.5 embryos were assayed by LS-MS to detect D2HG. For A and B, results are the mean ± SEM of triplicates; P-values, unpaired Student's t-test.
Figure 3.
Figure 3.
Altered intracellular ROS, increased NADP+/NADPH ratio, and epigenetic modifications in Nes-KI mice. (A) The effect of the mutant Idh1 enzyme on NADP+/NADPH homeostasis was evaluated in brain cells of Nes-WT (n = 6) and Nes-KI (n = 3) E14.5 embryos. The intracellular NADP+/NADPH ratio was determined as described in the Materials and Methods. (B) The GSH/GSSG ratio was determined to evaluate GST utilization in the brain cells of Nes-WT (n = 5) and Nes-KI (n = 5) E14.5 embryos. (C) The amount of reduced ascorbate was determined to evaluate ascorbate utilization in the brain cells of Nes-WT (n = 5) and Nes-KI (n = 4) E14.5 embryos. (D) ROS production by total brain cells of Nes-WT and Nes-KI E14.5 embryos was measured by flow cytometry using the fluorescent dye CM-H2DCFDA. (E) Catalase activity was evaluated in the brain cells of Nes-WT (n = 5) and Nes-KI (n = 4) E14.5 embryos. (F) Immunoblot of catalase protein in brain extracts from the indicated Nes-WT and Nes-KI embryos. Actin was used as a loading control. (G–I) ROS production by NSCs (prominin+) (G), GPCs (promininA2B5+) (H), and other brain cell types (DNs; promininA2B5) (I) from Nes-WT and Nes-KI E13.5 embryos was measured by flow cytometry using the fluorescent dye CM-H2DCFDA. (J) Proportions of NSCs, GPCs, and DNs among total brain cells from the embryos in GI. No alterations due to Idh1 R132 mutation were observed. (K) Acid extracts of brains from Nes-WT and Nes-KI E14.5 embryos were immunoblotted to detect levels of the indicated H3-methylated histones. Total H3 was used as a loading control. (L–N) Genomic DNA (300 ng) of NSCs (L) and GPCs (M) isolated from the brains of Nes-WT (n = 3) and Nes-KI (n = 3) E14.5 embryos was serially diluted and subjected to cytosine 5-methylenesulfonate (CMS) dot blotting to quantify 5hmC levels (Ko et al. 2010). A synthetic oligonucleotide (0.5 ng) containing a known amount of CMS was serially diluted and used as the standard. Data are representative of two independent experiments. Results of L and M are summarized graphically in N. (Horizontal lines) Median values (n = 3). For AC and E, results are the mean ± SEM of triplicates; P-values, unpaired Student's t-test. For D, F, GJ, results are representative of three independent trials. For K–N, results are representative of two independent trials.
Figure 4.
Figure 4.
Idh1 R132 stabilizes Hif1α protein and induces Hif1α target gene expression. (A) Brain tissue extracts from the indicated Nes-WT and Nes-KI embryos were immunoblotted to detect Hif1α protein levels. Actin was used as a loading control. Results are representative of three trials. (B,C) qRT–PCR analysis of Hif1a, Vegf, Glut-1, Pgk1, and Ang1 mRNA levels in Nes-WT and Nes-KI embryos at E13.5–E14.5 (B) or E15.5–E16.5 (C) (n = 7 per group). Data are expressed as the mean fold difference between Nes-WT (set to 1) and Nes-KI values after normalization to 18S rRNA. Results are the mean ± SEM of triplicates; P-values, unpaired Student's t-test. (NS) Not significant.
Figure 5.
Figure 5.
D2HG impairs collagen maturation and BM formation and induces an ER stress response. (A) Triton X-100-soluble proteins were prepared from the brains of E14.5 Nes-WT and Nes-KI embryos, and equal amounts of protein were subjected to 5% SDS-PAGE under reducing conditions. The indicated proteins were detected by immunoblotting. The difference in the size of type IV collagens α1 and α2 between Nes-WT and Nes-KI extracts reflects the reduced Hyl content of the collagen produced in mutant cells. Results are representative of four trials. (Unfilled arrowheads) α1/α2 type IV collagen bands in Nes-WT extracts; (filled arrowheads) immature α1/α2 type IV collagen bands in Nes-KI extracts. (B) Immunofluorescence analysis of type IV collagen (red) in the brains from one Nes-WT and two Nes-KI E15.5 embryos. Nuclei were counterstained with DAPI (blue). (White dotted lines) Outlines of blood vessel structures. Bars, 25 μm. (C,D) Total RNA was isolated from the brains of Nes-WT (n = 5) and Nes-KI (n = 5) embryos at E14.5 (C) or E15.5–16.5 (D), and mRNA levels of the indicated ER stress-responsive genes were analyzed by qRT–PCR. Data are expressed as the mean fold difference between Nes-WT (set to 1) and Nes-KI values after normalization to 18S rRNA. Results are the mean ± SEM of triplicates; P-values, unpaired Student's t-test.
Figure 6.
Figure 6.
The Idh1 R132 mutant protein profoundly alters the microenvironment supporting the interaction between astrocytes and endothelial cells, resulting in brain hemorrhage. (A) Relationship between Nes-Cre expression, D2HG production, and mutant mouse phenotypes. Schematic time line indicates Nes-Cre expression, with D2HG production shown in red. Arrows indicate the overall outcome for a given phenotype. (B) Model postulating how the Idh1 R132 mutant protein could promote brain hemorrhage. In a wild-type (IDH1-WT) astrocyte, type IV procollagen proteins in the ER are modified at their Pro and Lys residues, which allows the assembly of mature macromolecular collagen molecules that are secreted into the extracellular space and contribute to BM formation. An intact BM is crucial for sustaining proper interaction between astrocytes and endothelial cells. Routine degradation of HIF1/2α mediated by the actions of PHD and VHL maintains the intracellular homeostasis of wild-type astrocytes. In contrast, in astrocytes expressing the IDH1 R132 mutant protein (IDH1 Mut), we propose that intracellular homeostasis is perturbed by the large amounts of D2HG produced by the abnormal reaction catalyzed by IDH1 R132. D2HG inhibits collagen maturation, resulting in the formation of a fragile BM. Elevated D2HG also triggers an ER stress response, causing intrinsic cell death, and stabilizes HIF1/2α, leading to increased VEGF that drives aberrant blood vessel formation. These imbalances alter the microenvironment surrounding astrocytes and endothelial cells and affect the interaction between them, resulting in brain hemorrhage.

Similar articles

Cited by

  • The Roles of 2-Hydroxyglutarate.
    Du X, Hu H. Du X, et al. Front Cell Dev Biol. 2021 Mar 26;9:651317. doi: 10.3389/fcell.2021.651317. eCollection 2021. Front Cell Dev Biol. 2021. PMID: 33842477 Free PMC article. Review.
  • IDH1 Mutation Induces Reprogramming of Pyruvate Metabolism.
    Izquierdo-Garcia JL, Viswanath P, Eriksson P, Cai L, Radoul M, Chaumeil MM, Blough M, Luchman HA, Weiss S, Cairncross JG, Phillips JJ, Pieper RO, Ronen SM. Izquierdo-Garcia JL, et al. Cancer Res. 2015 Aug 1;75(15):2999-3009. doi: 10.1158/0008-5472.CAN-15-0840. Epub 2015 Jun 4. Cancer Res. 2015. PMID: 26045167 Free PMC article.
  • 2-Hydroxyglutarate in Cancer Cells.
    Ježek P. Ježek P. Antioxid Redox Signal. 2020 Nov 1;33(13):903-926. doi: 10.1089/ars.2019.7902. Epub 2020 Jan 22. Antioxid Redox Signal. 2020. PMID: 31847543 Free PMC article. Review.
  • Driver mutations of cancer epigenomes.
    Roy DM, Walsh LA, Chan TA. Roy DM, et al. Protein Cell. 2014 Apr;5(4):265-96. doi: 10.1007/s13238-014-0031-6. Epub 2014 Mar 14. Protein Cell. 2014. PMID: 24622842 Free PMC article.
  • Altered metabolite levels in cancer: implications for tumour biology and cancer therapy.
    Sullivan LB, Gui DY, Vander Heiden MG. Sullivan LB, et al. Nat Rev Cancer. 2016 Nov;16(11):680-693. doi: 10.1038/nrc.2016.85. Epub 2016 Sep 23. Nat Rev Cancer. 2016. PMID: 27658530 Review.

References

    1. Amary MF, Bacsi K, Maggiani F, Damato S, Halai D, Berisha F, Pollock R, O'Donnell P, Grigoriadis A, Diss T, et al. 2011a. IDH1 and IDH2 mutations are frequent events in central chondrosarcoma and central and periosteal chondromas but not in other mesenchymal tumours. J Pathol 224: 334–343 - PubMed
    1. Amary MF, Damato S, Halai D, Eskandarpour M, Berisha F, Bonar F, McCarthy S, Fantin VR, Straley KS, Lobo S, et al. 2011b. Ollier disease and Maffucci syndrome are caused by somatic mosaic mutations of IDH1 and IDH2. Nat Genet 43: 1262–1265 - PubMed
    1. Bajenaru ML, Zhu Y, Hedrick NM, Donahoe J, Parada LF, Gutmann DH 2002. Astrocyte-specific inactivation of the neurofibromatosis 1 gene (NF1) is insufficient for astrocytoma formation. Mol Cell Biol 22: 5100–5113 - PMC - PubMed
    1. Ballabh P, Braun A, Nedergaard M 2004. The blood-brain barrier: An overview: Structure, regulation, and clinical implications. Neurobiol Dis 16: 1–13 - PubMed
    1. Belteki G, Haigh J, Kabacs N, Haigh K, Sison K, Costantini F, Whitsett J, Quaggin SE, Nagy A 2005. Conditional and inducible transgene expression in mice through the combinatorial use of Cre-mediated recombination and tetracycline induction. Nucleic Acids Res 33: e51 doi: 10.1093/nar/gki559 - PMC - PubMed

Publication types

LinkOut - more resources