. 2012;8(8):e1002855.
doi: 10.1371/journal.pgen.1002855. Epub 2012 Aug 9.

Modulating the strength and threshold of NOTCH oncogenic signals by mir-181a-1/b-1

Affiliations

Modulating the strength and threshold of NOTCH oncogenic signals by mir-181a-1/b-1

Rita Fragoso et al. PLoS Genet. 2012.

Abstract

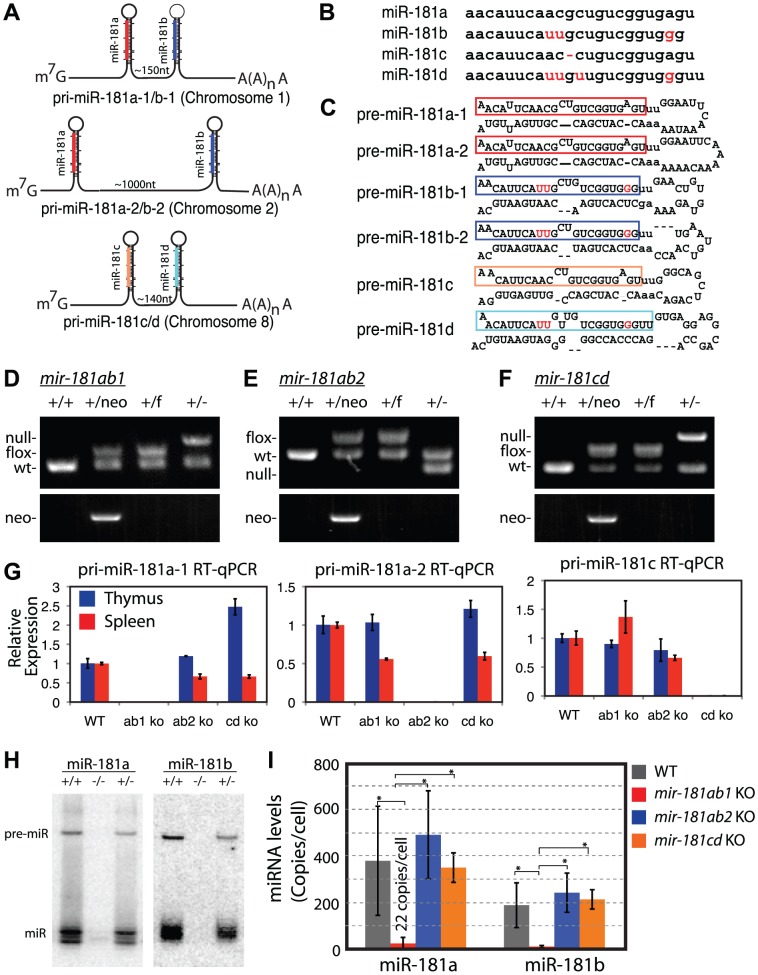
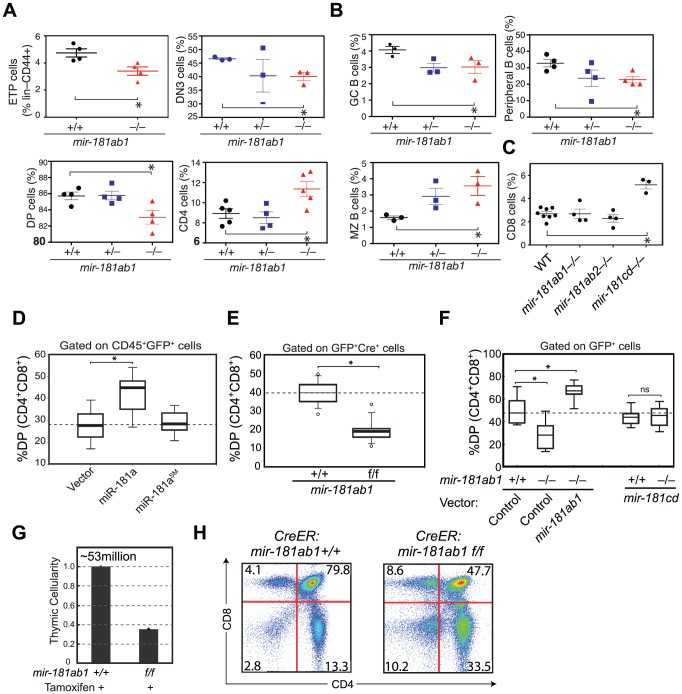
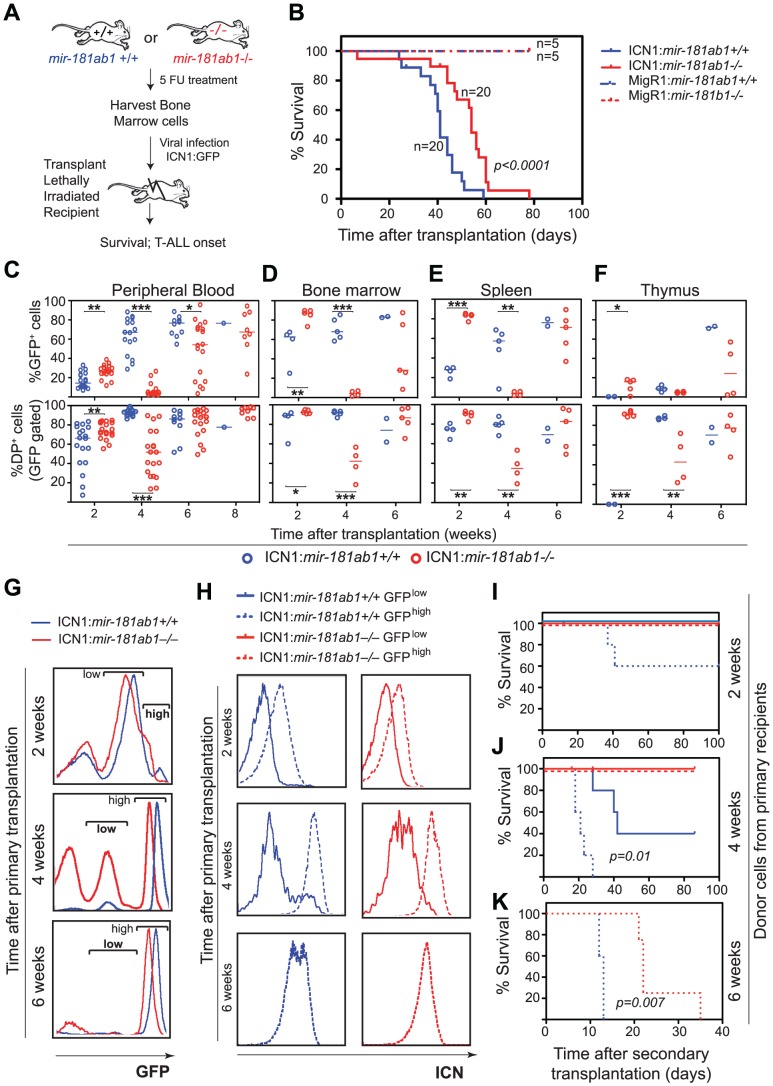
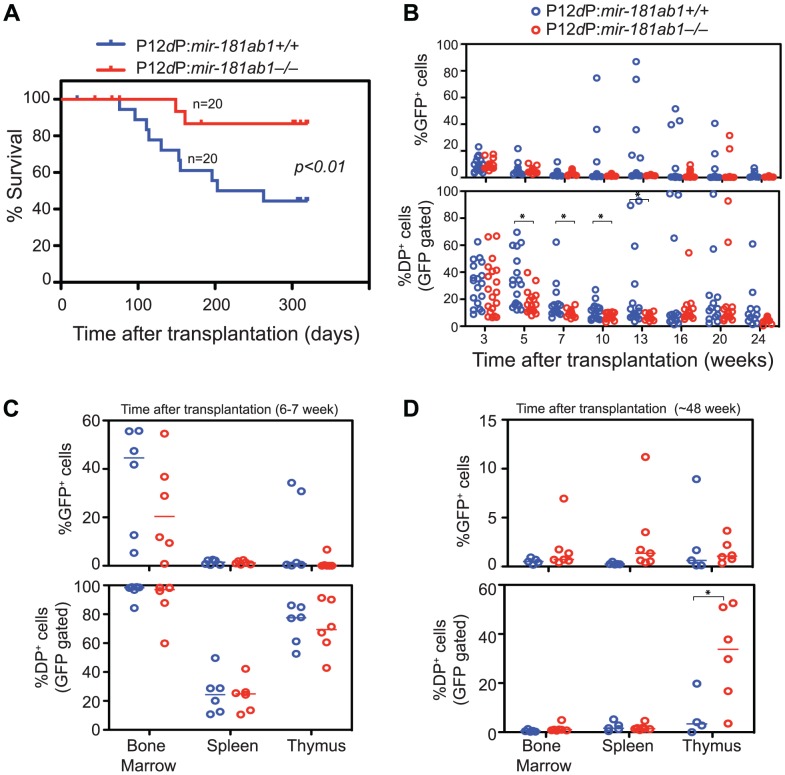
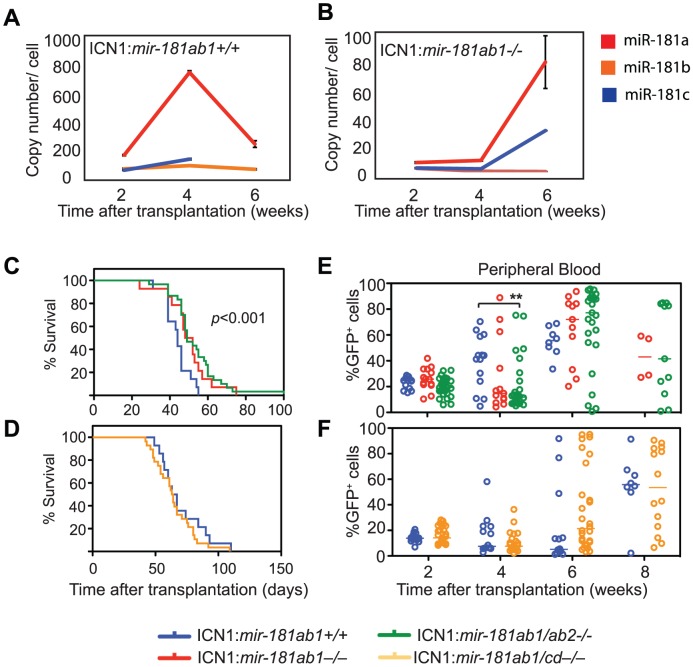
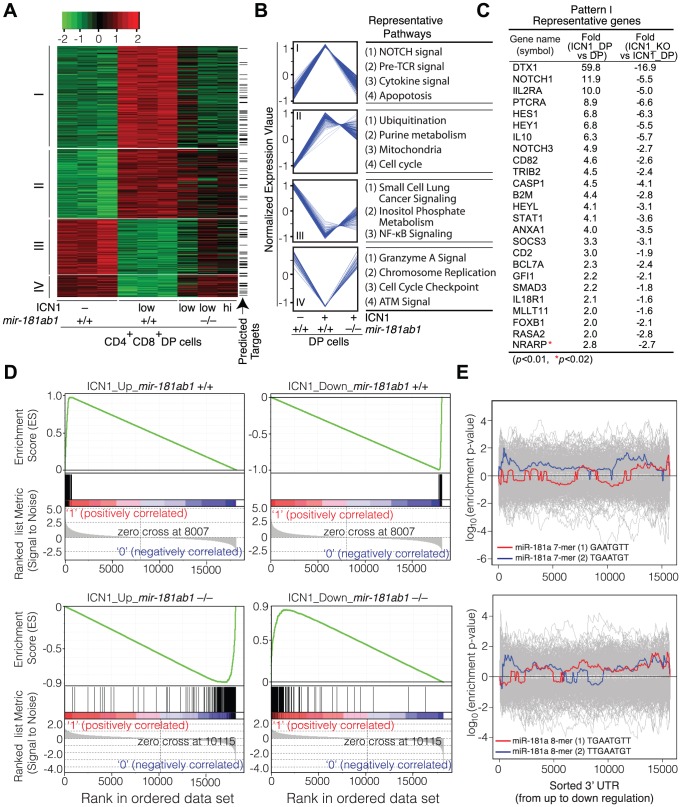
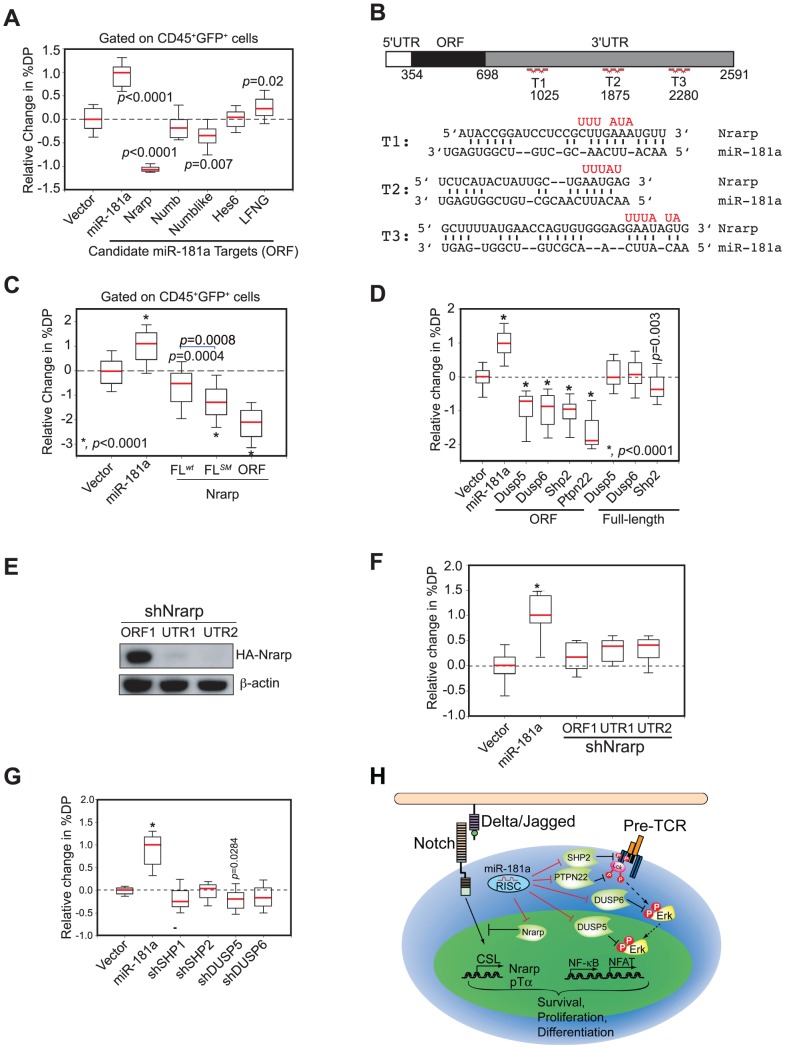
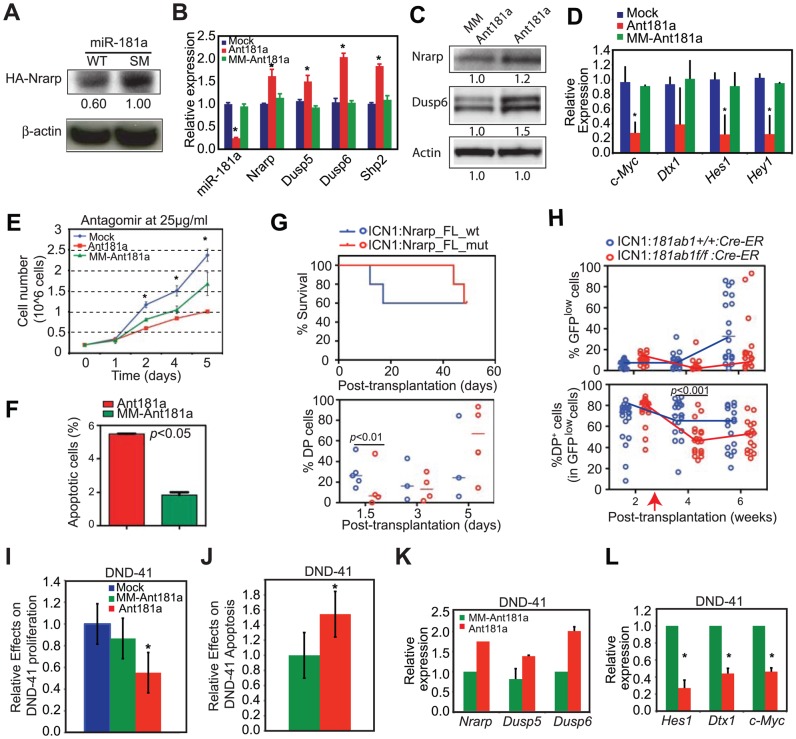
Oncogenes, which are essential for tumor initiation, development, and maintenance, are valuable targets for cancer therapy. However, it remains a challenge to effectively inhibit oncogene activity by targeting their downstream pathways without causing significant toxicity to normal tissues. Here we show that deletion of mir-181a-1/b-1 expression inhibits the development of Notch1 oncogene-induced T cell acute lymphoblastic leukemia (T-ALL). mir-181a-1/b-1 controls the strength and threshold of Notch activity in tumorigenesis in part by dampening multiple negative feedback regulators downstream of NOTCH and pre-T cell receptor (TCR) signaling pathways. Importantly, although Notch oncogenes utilize normal thymic progenitor cell genetic programs for tumor transformation, comparative analyses of mir-181a-1/b-1 function in normal thymocyte and tumor development demonstrate that mir-181a-1/b-1 can be specifically targeted to inhibit tumor development with little toxicity to normal development. Finally, we demonstrate that mir-181a-1/b-1, but not mir-181a-2b-2 and mir-181-c/d, controls the development of normal thymic T cells and leukemia cells. Together, these results illustrate that NOTCH oncogene activity in tumor development can be selectively inhibited by targeting the molecular networks controlled by mir-181a-1/b-1.


Conflict of interest statement

The authors have declared that no competing interests exist.

Figures

Figure 1
Figure 1. Generation of conditional mir-181 alleles in mice.
(A) Schematics of putative primary miR-181 transcripts. (B) Alignment of mouse miR-181 family mature miRNAs. (C) Predicted stem-loop structures of miR-181 family miRNAs. (D-F) PCR confirmation of the deletion of neo cassette and (D) mir-181ab1, (E) mir-181ab2 and (F) mir-181c/d. (G) RT-qPCR analyses of primary miR-181 expression in the thymus (blue) and spleen (red) of mir-181 knockout mice. (H) Northern blot analyses to confirm loss of miR-181a and miR-181b expression in the thymus upon the loss of mir-181ab1 alleles. (I) Mature miR-181a and miR-181b expression in DP cells from WT, mir-181ab1 −/− and mir-181ab2 −/− mice determined by quantitative miRNA PCR analyses (n = 2, *, p<0.05, Student's t-test).
Figure 2
Figure 2. Effects of mir-181ab1 deletion on normal development.
(A and B) Effects of germline deletion of mir-181ab1 on (A) T lymphocyte and (B) B lymphocyte development (*, p<0.05, Mann-Whitney rank sum tests). (C) Effects of germline deletion of mir-181cd on CD8 thymocyte development. (D) Effects of mir-181a-1 ectopic expression on DP thymocyte development determined by the OP9-DL1 assay. (E) Effects of Cre-mediated deletion of mir-181ab1 on DP thymocyte development determined using the OP9-DL1 assay. (F) Effects of germline mir-181ab1 deletion and mir-181cd deletion on DP thymocyte development in the OP9-DL1 assay. (G and H) Effects of induced deletion of the mir-181ab1 alleles on thymocyte development in vivo. CreER:mir-181ab1+/+ and CreER:mir-181ab1f/f mice were injected with tamoxifen four times at two-day intervals to induce the deletion of mir-181ab1 alleles and analyzed at day 5 after the last tamoxifen injection to determine (G) thymic cellularity and (H) CD4/CD8 profiles. Representative results of two independent analyses are summarized or presented in (G) and (H).
Figure 3
Figure 3. Loss of mir-181ab1 delays T-ALL and inhibits T-ALL development induced by low levels of ICN1.
(A) Schematic of experimental design. (B) Kaplan-Meier survival curves show the effect of loss of mir-181ab1 on the percentages of mice surviving at different time points after T-ALL induction with ICN1 (p<0.0001, n = 20 mice/experimental group, a representative plot of 4 independent experiments is shown). (C–F) Effects of loss of mir-181ab1 on the percentage of total ICN1-infected cells (all GFP+ cells) and the percent of ICN1-infected DP leukemia cells (GFP+DP cells) in (C) peripheral blood, (D) bone marrow, (E) spleen and (F) thymus of T-ALL mice (*, p<0.05; **, p<0.01; ***, p<0.001;). (G) Mice transplanted with ICN1:181ab1+/+ or ICN1:181ab1−/− BM cells have distinct profiles of GFP+ cells at 2, 4 and 6 weeks after transplantation. Gates that define GFPhigh and GFPlow cells are indicated. (H) Relative levels of ICN1 expression in GFPhigh and GFPlow cells were determined by intracellular staining of ICN1 and FACS analyses. (I–K) The Kaplan-Meier survival curves of the secondary transplantation analyses. ICN1-infected DP cells (GFP+ DP cells) were sorted from primary recipients at (I) 2, (J) 4 and (K) 6 weeks after transplantation and transferred to each of five secondary recipients. Secondary recipients were analyzed for survival and development of DP leukemia cells in the peripheral blood to determine the leukemogenic potentials of GFPhigh and GFPlow cells from primary recipients transplanted with ICN1:181ab1+/+ and ICN1:181ab1−/− BM cells.
Figure 4
Figure 4. Loss of mir-181ab1 inhibits leukemia development induced by the human NOTCH1 mutant P12ΔP.
(A) Kaplan-Meier survival curve showing the effects of loss of mir-181ab1 on the percentages of mice surviving at different time points after T-ALL induction with P12ΔP (p<0.01, n = 20 mice/experimental group, a representative plot of two independent experiments is shown). (B) Effects of loss of mir-181ab1 on the percentage of total P12ΔP-infected cells (all GFP+ cells) and the percent of P12ΔP-infected DP cells (GFP+ DP cells) in peripheral blood at different time points after reconstitution (*, p<0.05). (C and D) The percentage of GFP+ cells (upper panel) and GFP+ DP cells (lower panel) in BM, spleen and thymus of T-ALL mice at (C) 6 to 7 weeks or (D) ∼48 weeks after transplantation (*, p<0.05).
Figure 5
Figure 5. The differential effects of loss of individual mir-181 family genes on ICN1-induced T-ALL.
(A and B) Copy numbers of mature miR-181a, miR-181b, miR181c and miR-181d in ICN1-infected DP cells from (A) ICN1:181ab1+/+ and (B) ICN1:181ab1−/− recipient mice at 2, 4 and 6 weeks post-transplantation determined by standard curve-based miRNA qPCR analyses. (C and D) Kaplan-Meier survival curves indicate the percentage of mice (20 mice/group) surviving at different time points after reconstituting with (C) ICN1-infected mir-181ab1/ab2−/− (p<0.001) or (D) ICN1-infected mir-181ab1/cd−/− BM cells (p>0.05). (E and F) Effects of loss of mir-181 family genes on the percentage of total ICN1-infected cells (all GFP+ cells) in peripheral blood at different time points after reconstitution (**, p<0.01).
Figure 6
Figure 6. Loss of mir-181ab1 in DP leukemia cells inhibits ICN1-controlled genetic programs.
(A) Hierarchical clustering of genes showing differential expression of ICN1- controlled genes in DP leukemia cells and their expression upon mir-181ab1 deletion (p<0.01 and fold change >2, n = 548). Predicted targets of miR-181a are highlighted and indicated with arrows. (B) The normalized expression patterns of four gene clusters and the representative functional pathways in corresponding clusters (see Table S3 for full list of genes). (C) Representative genes from cluster I and corresponding changes in expression levels in response to ICN1 expression or mir-181ab1 deletion are shown. (D) Gene set enrichment analyses showing the effects of mir-181ab1 deletion in the gene sets up-regulated (n = 376; upper left panel) and down-regulated (n = 172; upper right panel) by ICN1. (E) Enrichment of 7- and 8-mer miR-181a seed sequences among the differentially expressed genes caused by the loss of mir-181ab1 in DP leukemia cells was determined by Sylamer analysis. The colored and gray lines correspond to enrichment of miR-181a seeds and unrelated miRNA seeds, respectively.
Figure 7
Figure 7. mir-181ab1 controls the negative feedbacks in NOTCH1 and pre-TCR pathways during normal thymocyte development.
(A) The coding regions of individual candidate targets, which lack all or a majority of predicted miR-181a binding sites, were expressed in thymic progenitors, and their effects on DP cell development were determined by using the OP9-DL1 assay (box plots, n = 12, representative analysis of three independent experiments shown). (B) Wild-type and mutant (red) miR-181a target sites in the Nrarp 3′UTR (T1, T2, T3) and the predicted base pairings between mouse Nrarp and miR-181a. (C) Functional regulation of Nrarp by miR-181a during early T cell development. The Nrarp gene with a wild-type full-length UTR (FLwt) or a full-length UTR with the miR-181a-binding site mutated (FLmut) were ectopically expressed in thymic progenitors and tested for effects on early thymocyte development (box plots, n = 48; replicates pooled from four independent experiments). (D) miR-181a-sensitive (ORF+3′UTR) and miR-181a-insensitive (ORF only) phosphatases were ectopically expressed in thymic progenitors and cultured over OP9-DL1 stromal cells to examine their effects on DP development (*, p<0.0001). (E) Nrarp shRNAs suppress expression of Nrarp protein as determined by western blot analyses. (F) Effects of Nrarp shRNAs on DP cell development in the OP9-DL1 assay (*, p<0.05). (G) Effects of shRNAs targeting SHP1, SHP2, DUSP5 or DUSP6 on DP cell development in the OP9-DL1 assay. Data in (F) and (G) are displayed as a relative change in % DP in box plots (n = 12, representative of three independent experiments, *, p<0.0001). (H) Schematic diagram of the mechanism by which miR-181a may regulate normal T cell development.
Figure 8
Figure 8. Targets of miR-181a in T-ALL cells and the effects of miR-181a inhibition in T-ALL cells.
(A) Western blot analyses were used to determine the levels of HA-tagged Nrarp protein in T6E cell lines expressing wild-type miR-181a or miR-181aSM (normalized to β-actin loading control). (B–D) Levels of miR-181a target expression determined by (B) qPCR or (C) western blot analyses and (D) Notch1 target expression in mock-treated T6E cells or cells treated with 10 µg/ml antagomir against miR-181a (Ant181a) or mismatch control (MM-Ant181a) for 48 hours (mean ± SD, n = 3, *p<0.05). (E and F) Effects of Ant181a and MM-Ant181a on T6E leukemia cell (E) proliferation and (F) apoptosis (mean ± SD, n = 3, *, p<0.05). (G) Kaplan-Meier survival curves and the percentages of ICN1-infected DP cells show the effects of Nrarp target expression on ICN1-induced T-ALL development (5 mice/group). Sorted ICN1-BM cells from primary recipient mice were infected with the same titer of virus expressing either Nrarp-FLmut (miR-181a-insensitive) or Nrarp-FLw t (miR-181a-sensitive) and transplanted into lethally irradiated recipients (5 mice/group). (H) Effects of conditional deletion of mir-181ab1 on the T-ALL development at 2 weeks after leukemia induction (see also Figures S8A, B). Percentages of GFPlow and GFPlow DP cells in the peripheral blood of recipient mice transplanted with either ICN1:181ab1+/+/Cre-ER BM cells or ICN1:181a1b1f/f/Cre-ER BM cells were determined by FACS analyses (20 mice/group). Red arrow indicates the initiation of CreER-mediated mir-181ab1 deletion. (I and J) Effects of Ant181a and MM-Ant181a (25 µg/ml) on human T-ALL DND41 cell (I) proliferation and (J) apoptosis after 96 h in culture (mean ± SD, n = 4, *, p<0.05). (K and L) Levels of (K) miR-181a targets and (L) Notch1 target expression in DND41 cells treated with Ant181a (25 µg/ml) for 48 hours (mean ± SD, n = 3, *p<0.05).

Similar articles

Cited by

References

    1. He L, Thomson JM, Hemann MT, Hernando-Monge E, Mu D, et al. (2005) A microRNA polycistron as a potential human oncogene. Nature 435: 828–833. - PMC - PubMed
    1. Mavrakis KJ, Van Der Meulen J, Wolfe AL, Liu X, Mets E, et al. (2011) A cooperative microRNA-tumor suppressor gene network in acute T-cell lymphoblastic leukemia (T-ALL). Nat Genet - PMC - PubMed
    1. Costinean S, Zanesi N, Pekarsky Y, Tili E, Volinia S, et al. (2006) Pre-B cell proliferation and lymphoblastic leukemia/high-grade lymphoma in E(mu)-miR155 transgenic mice. Proc Natl Acad Sci U S A 103: 7024–7029. - PMC - PubMed
    1. Medina PP, Nolde M, Slack FJ (2010) OncomiR addiction in an in vivo model of microRNA-21-induced pre-B-cell lymphoma. Nature 467: 86–90. - PubMed
    1. Kota J, Chivukula RR, O'Donnell KA, Wentzel EA, Montgomery CL, et al. (2009) Therapeutic microRNA delivery suppresses tumorigenesis in a murine liver cancer model. Cell 137: 1005–1017. - PMC - PubMed

Publication types

MeSH terms

LinkOut - more resources