. 2012 Jul-Aug;19(4):221-32.
doi: 10.1111/j.1399-3089.2012.00711.x.

Costimulation blockade in pig artery patch xenotransplantation - a simple model to monitor the adaptive immune response in nonhuman primates

Affiliations

Costimulation blockade in pig artery patch xenotransplantation - a simple model to monitor the adaptive immune response in nonhuman primates

Mohamed B Ezzelarab et al. Xenotransplantation. 2012 Jul-Aug.

Abstract

Background: CD154 blockade-based immunosuppression successfully prevents both humoral and cellular adaptive immune responses in baboons receiving α1,3-galactosyltransferase gene-knockout (GTKO) pig organs. Using a GTKO pig artery transplantation model in baboons, we evaluated the efficacy of CD28/B7 costimulatory pathway blockade in comparison with CD154 blockade.

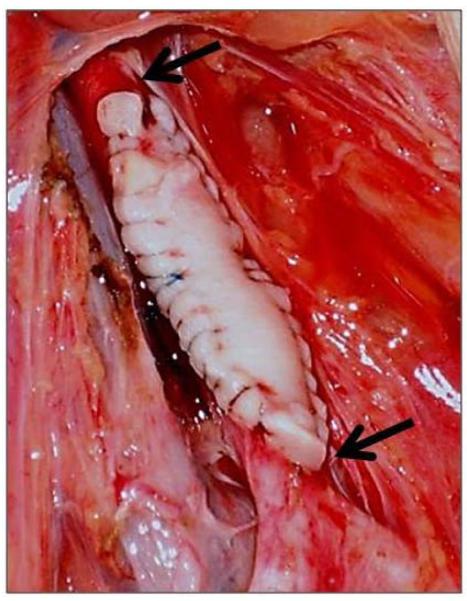
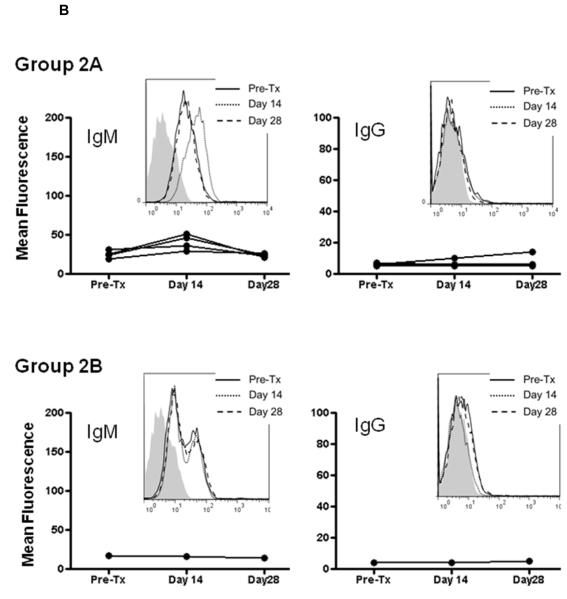
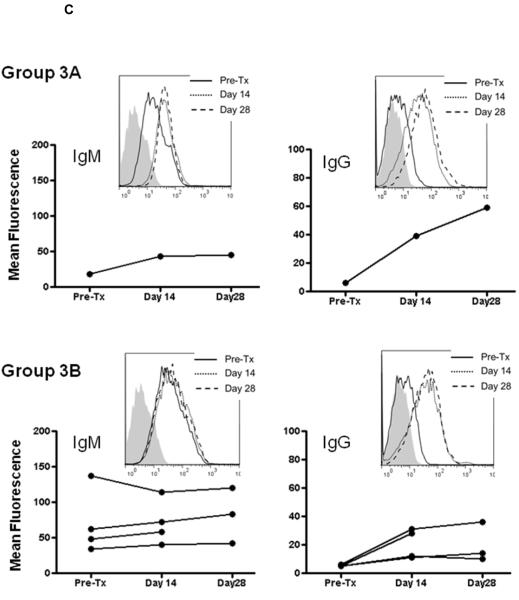
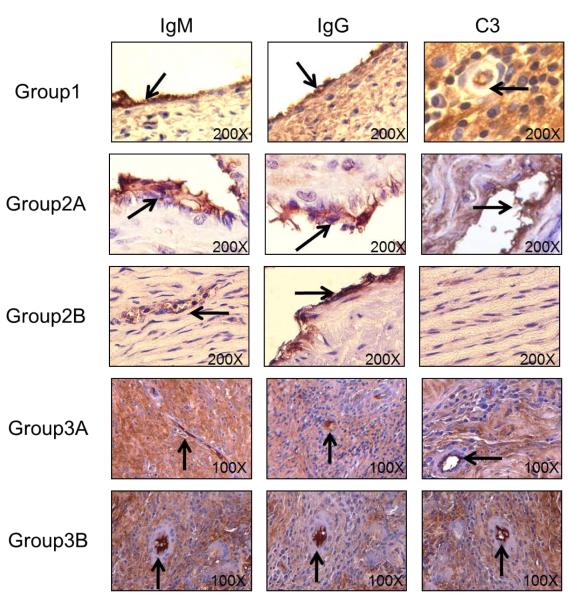
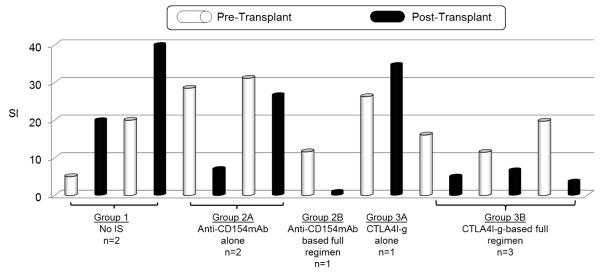
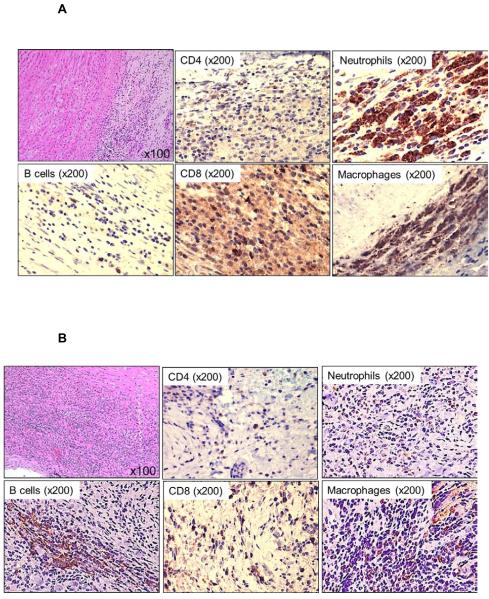
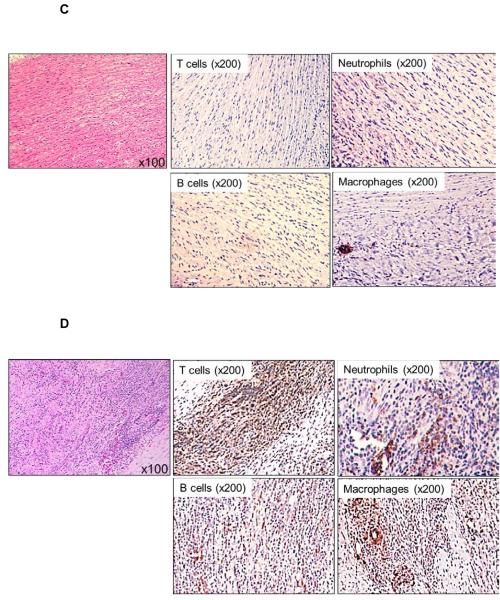
Methods: Baboons received artery patch grafts from GTKO pigs, with no (Group1), anti-CD154mAb-based (Group2), or CTLA4-Ig-based (Group3) immunosuppressive therapy. Anti-pig IgM and IgG antibody and cellular responses were monitored. Xenografts were immunohistologically evaluated for antibody and complement deposition, and cellular infiltration.

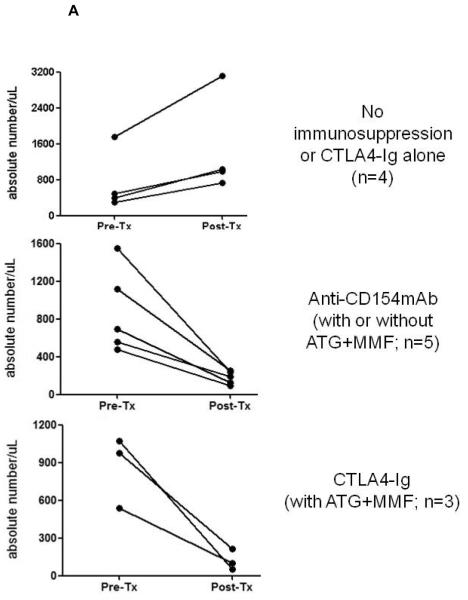
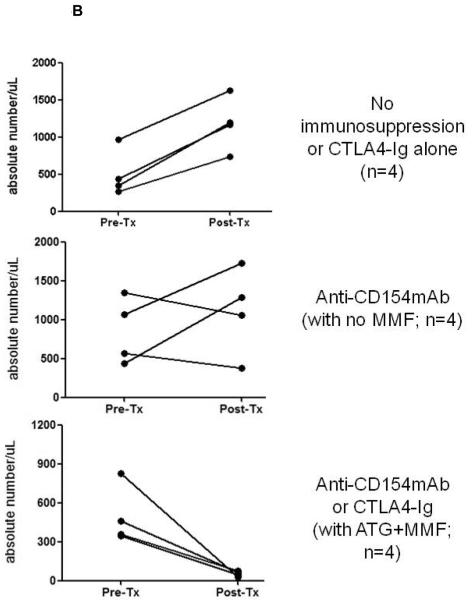
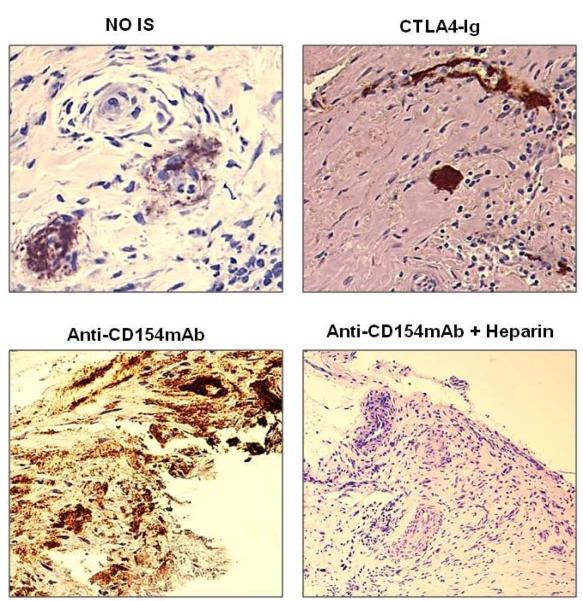
Results: Group1 baboons developed increased IgM and IgG antibody and cellular responses against GTKO antigens. In Group2, anti-CD154mAb alone prevented the development of both IgM and IgG antibody and cellular responses,but not cellular infiltration of the graft. In the single baboon that received anti-thymocyte globulin (ATG) + mycophenolate mofetil (MMF) + anti-CD154mAb, cellular infiltration of the graft was not seen. In Group3, CTLA4-Ig with ATG + MMF inhibited the cellular proliferative response to pig antigens but did not prevent the IgG response or cellular infiltration.

Conclusions: (i) Artery patch transplantation is a simple model to monitor the adaptive immune response to xenografts; (ii) anti-CD154mAb prevents sensitization but not cellular infiltration (but, without anticoagulation, may result in early thrombosis of a pig xenograft); (iii) although in only one baboon, the addition of ATG and MMF prevents cellular infiltration and (iv) replacement of anti-CD154mAb by CTLA4-Ig (at the doses used), even in combination with ATG and MMF, prevents the cellular proliferative response to GTKO pig antigens but is insufficient to prevent the development of anti-pig antibodies.


Figures

Figure 1
Figure 1. GTKO pig artery patch xenograft
After exposure of the recipient abdominal aorta (below the renal arteries and above the bifurcation), the pig artery patch (2×1cm) was sutured in place as an onlay graft. Arrows indicate the extent of the graft.
Figure 2
Figure 2. IgM and IgG antibody levels in baboon recipients of GTKO pig artery patches
IgM (left) and IgG (right) antibodies were measured by flow cytometry. Graphs represent relative mean fluorescence values (as described in Methods). Insets represent histograms for one representative recipient from each group (before Tx [solid line], 14 days after Tx [dotted line], and 28 days after Tx [dashed line]; isotype controls are in grey). (A) Group 1 (no immunosuppression) showing initial increase in IgM followed by decline, and rise im IgG. (B) Group 2A (anti-CD154mAb alone) – slight transient increase in IgM, and no or possible minimal increase in IgG, and Group 2B (anti-CD154mAb+ATG+MMF) - no significant increase in IgM or IgG. (C) Group 3A (CTLA4-Ig alone) - increased IgM and IgG, and Group 3B (CTLA4-Ig+ATG+MMF) – a very slight increase in IgM in 3 baboons, and a clear increase in IgG in 2 baboons.
Figure 3
Figure 3. Antibody and complement deposition in GTKO pig artery patch xenograft recipients
By immunohistochemistry, deposition of antibodies (IgM and IgG) and complement (C3) were determined in aortic patch xenografts. Magnification is indicated in each figure. Brown indicates positive staining. In Group 1 (no immunosuppression), and in Groups 2A, 3A and 3B antibody and complement deposition were detected in all grafts. With an anti-CD154mAb-based full regimen (Group 2B), minimal IgM, strong IgG, and no complement deposition were detected. (Arrows indicate positive staining)
Figure 4
Figure 4. Cellular response in GTKO pig artery patch recipients
Baboon PBMC were collected before (white) and one month after (black) artery patch Tx, and were tested for proliferation in response to irradiated GTKO PBMC in MLR. Proliferation is presented as stimulation index (SI). PBMC proliferation was increased with either no immunosuppression (Group 1) or when CTLA4-Ig alone was administered (Group 3A). There was minimal or no increase in PBMC proliferation when anti-CD154mAb alone was administered (Group 2A), and no increase when an anti-CD154mAb-based full regimen (Group 2B) or a CTLA4-Ig-based full regimen (Group 3B) was administered.
Figure 5
Figure 5. CD4+ and CD8+ T cell kinetics in artery patch recipients
Absolute numbers of (A) CD4+ and (B) CD8+ T cells were monitored in the blood, before and 21-28 days after Tx. Whole blood samples were analyzed by flow cytometry to obtain the percentages of CD4+ (A) and CD8+ (B) T cells, and absolute numbers were calculated based on the total white blood cell count. (Note that the results are not presented by Group, as in the other figures.) In (A), data are presented from recipients with no immunosuppressive therapy or CTLA4-Ig alone (top), anti-CD154mAb +/− ATG+MMF (middle), or with the CTLA4-Ig-based full regimen (bottom). In (B), data in are presented from recipients with no immunosuppressive therapy or CTLA4-Ig alone (top), anti-CD154mAb alone (middle), or with the anti-CD154mAb- or CTLA4-Ig-based full regimens (bottom).
Figure 6
Figure 6. Cellular infiltration of innate and adaptive immune cells in GTKO pig artery patches
Histology of pig artery patches (H&E), and, by immunohistochemistry, infiltration with T cells (CD3+, CD4+, CD8+), B cells (CD20), neutrophils and macrophages (CD68) was assessed. Magnification is indicated in each figure. Positive cellular staining is in brown. (A) With no immunosuppression (Group1), there was strong cellular infiltration, including CD4+ and CD8+ T cells, B cells, neutrophils, and macrophages. (B) When anti-CD154mAb was administered alone (Group 2A), cellular infiltration consisted mainly of B cells, macrophages and neutrophils, with fewer CD4+ and CD8+ T cells. (C) With the anti-CD154mAb-based full regimen (Group 2B), there were no T cell, B cell, or neutrophil infiltrates, and very few macrophages. (D) When CTLA4-Ig was administered alone (Group 3A), there was strong T and B cellular infiltration, with fewer macrophages. (E) With the CTLA4-Ig-based full regimen (Group 3B), cell infiltration consisted more of macrophages and neutrophils, with fewer CD4+ and CD8+ T cells, and no B cells.
Figure 7
Figure 7. Platelet deposition in GTKO pig artery patches
Platelet deposition in the aortic patches was assessed by immunohistochemistry. Platelet deposition (CD42+) was detected in the patches in Group 1 (top left) and Group 3 (top right) and in the Group 2 patches when ketorolac was administered (bottom left). Only when heparin was administered with the anti-CD154mAb-based full regimen was platelet deposition absent (bottom right).

Similar articles

Cited by

References

    1. Phelps CJ, Koike C, Vaught TD, Boone J, Wells KD, Chen SH, et al. Production of alpha 1,3-galactosyltransferase-deficient pigs. Science. 2003;299(5605):411–4. - PMC - PubMed
    1. Kolber-Simonds D, Lai L, Watt SR, Denaro M, Arn S, Augenstein ML, et al. Production of alpha-1,3-galactosyltransferase null pigs by means of nuclear transfer with fibroblasts bearing loss of heterozygosity mutations. Proc Natl Acad Sci U S A. 2004;101(19):7335–40. PMCID: 409919. - PMC - PubMed
    1. Kuwaki K, Tseng YL, Dor FJ, Shimizu A, Houser SL, Sanderson TM, et al. Heart transplantation in baboons using alpha1,3-galactosyltransferase gene-knockout pigs as donors: initial experience. Nat Med. 2005;11(1):29–31. - PubMed
    1. Tseng YL, Kuwaki K, Dor FJ, Shimizu A, Houser S, Hisashi Y, et al. alpha1,3-Galactosyltransferase gene-knockout pig heart transplantation in baboons with survival approaching 6 months. Transplantation. 2005;80(10):1493–500. - PubMed
    1. Houser SL, Kuwaki K, Knosalla C, Dor FJ, Gollackner B, Cheng J, et al. Thrombotic microangiopathy and graft arteriopathy in pig hearts following transplantation into baboons. Xenotransplantation. 2004;11(5):416–25. - PubMed

Publication types

MeSH terms

Substances

LinkOut - more resources