Toward a combinatorial nature of microRNA regulation in human cells
- PMID: 22904063
- PMCID: PMC3479204
- DOI: 10.1093/nar/gks759
Toward a combinatorial nature of microRNA regulation in human cells
Abstract
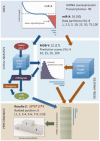
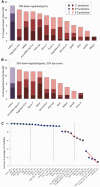
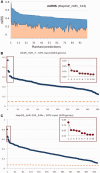
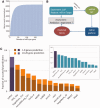
MicroRNAs (miRNAs) negatively regulate the levels of messenger RNA (mRNA) post-transcriptionally. Recent advances in CLIP (cross-linking immunoprecipitation) technology allowed capturing miRNAs with their cognate mRNAs. Consequently, thousands of validated mRNA-miRNA pairs have been revealed. Herein, we present a comprehensive outline for the combinatorial regulation by miRNAs. We implemented combinatorial and statistical constraints in the miRror2.0 algorithm. miRror estimates the likelihood of combinatorial miRNA activity in explaining the observed data. We tested the success of miRror in recovering the correct miRNA from 30 transcriptomic profiles of cells overexpressing a miRNA, and to identify hundreds of genes from miRNA sets, which are observed in CLIP experiments. We show that the success of miRror in recovering the miRNA regulation from overexpression experiments and CLIP data is superior in respect to a dozen leading miRNA-target prediction algorithms. We further described the balance between alternative modes of joint regulation that are executed by pairs of miRNAs. Finally, manipulated cells were tested for the possible involvement of miRNA in shaping their transcriptomes. We identified instances in which the observed transcriptome can be explained by a combinatorial regulation of miRNA pairs. We conclude that the joint operation of miRNAs is an attractive strategy to maintain cell homeostasis and overcoming the low specificity inherent in individual miRNA-mRNA interaction.
Figures
Similar articles
-
miRror-Suite: decoding coordinated regulation by microRNAs.Database (Oxford). 2014 Jun 6;2014:bau043. doi: 10.1093/database/bau043. Print 2014. Database (Oxford). 2014. PMID: 24907353 Free PMC article.
-
Working together: combinatorial regulation by microRNAs.Adv Exp Med Biol. 2013;774:317-37. doi: 10.1007/978-94-007-5590-1_16. Adv Exp Med Biol. 2013. PMID: 23377980 Review.
-
miRror2.0: a platform for assessing the joint action of microRNAs in cell regulation.J Bioinform Comput Biol. 2013 Dec;11(6):1343012. doi: 10.1142/S0219720013430129. J Bioinform Comput Biol. 2013. PMID: 24372041
-
miRTar2GO: a novel rule-based model learning method for cell line specific microRNA target prediction that integrates Ago2 CLIP-Seq and validated microRNA-target interaction data.Nucleic Acids Res. 2017 Apr 7;45(6):e42. doi: 10.1093/nar/gkw1185. Nucleic Acids Res. 2017. PMID: 27903911 Free PMC article.
-
One decade of development and evolution of microRNA target prediction algorithms.Genomics Proteomics Bioinformatics. 2012 Oct;10(5):254-63. doi: 10.1016/j.gpb.2012.10.001. Epub 2012 Oct 23. Genomics Proteomics Bioinformatics. 2012. PMID: 23200135 Free PMC article. Review.
Cited by
-
A microRNA-microRNA crosstalk network inferred from genome-wide single nucleotide polymorphism variants in natural populations of Arabidopsis thaliana.Front Plant Sci. 2022 Aug 26;13:958520. doi: 10.3389/fpls.2022.958520. eCollection 2022. Front Plant Sci. 2022. PMID: 36131801 Free PMC article.
-
CircRNA-016901 silencing attenuates irradiation-induced injury in bone mesenchymal stem cells via regulating the miR-1249-5p/HIPK2 axis.Exp Ther Med. 2021 Apr;21(4):355. doi: 10.3892/etm.2021.9786. Epub 2021 Feb 11. Exp Ther Med. 2021. PMID: 33732328 Free PMC article.
-
miRror-Suite: decoding coordinated regulation by microRNAs.Database (Oxford). 2014 Jun 6;2014:bau043. doi: 10.1093/database/bau043. Print 2014. Database (Oxford). 2014. PMID: 24907353 Free PMC article.
-
Epigenetic regulation in the tumor microenvironment: molecular mechanisms and therapeutic targets.Signal Transduct Target Ther. 2023 May 22;8(1):210. doi: 10.1038/s41392-023-01480-x. Signal Transduct Target Ther. 2023. PMID: 37217462 Free PMC article. Review.
-
Methylated microRNA genes of the developing murine palate.Microrna. 2014;3(3):160-73. doi: 10.2174/2211536604666150131125805. Microrna. 2014. PMID: 25642850 Free PMC article.
References
-
- Bartel DP. MicroRNAs: genomics, biogenesis, mechanism, and function. Cell. 2004;116:281–297. - PubMed
-
- Calin GA, Ferracin M, Cimmino A, Di Leva G, Shimizu M, Wojcik SE, Iorio MV, Visone R, Sever NI, Fabbri M, et al. A MicroRNA signature associated with prognosis and progression in chronic lymphocytic leukemia. N. Engl. J. Med. 2005;353:1793–1801. - PubMed
-
- Grad Y, Aach J, Hayes GD, Reinhart BJ, Church GM, Ruvkun G, Kim J. Computational and experimental identification of C. elegans microRNAs. Mol. Cell. 2003;11:1253–1263. - PubMed
-
- Friedlander MR, Chen W, Adamidi C, Maaskola J, Einspanier R, Knespel S, Rajewsky N. Discovering microRNAs from deep sequencing data using miRDeep. Nat. Biotechnol. 2008;26:407–415. - PubMed

