

Normalization of ChIP-seq data with control
- PMID: 22883957
- PMCID: PMC3475056
- DOI: 10.1186/1471-2105-13-199
Normalization of ChIP-seq data with control
Abstract
Background: ChIP-seq has become an important tool for identifying genome-wide protein-DNA interactions, including transcription factor binding and histone modifications. In ChIP-seq experiments, ChIP samples are usually coupled with their matching control samples. Proper normalization between the ChIP and control samples is an essential aspect of ChIP-seq data analysis.
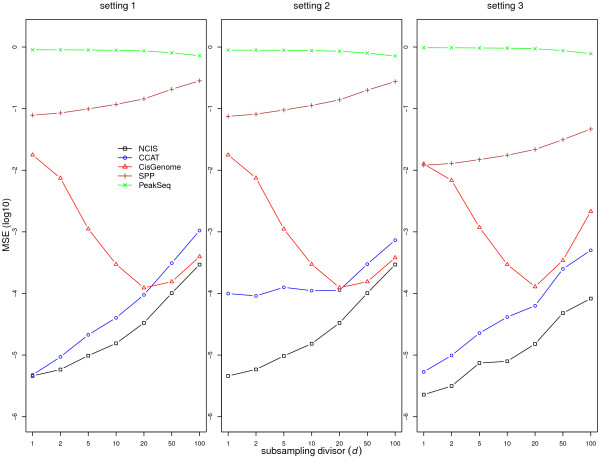
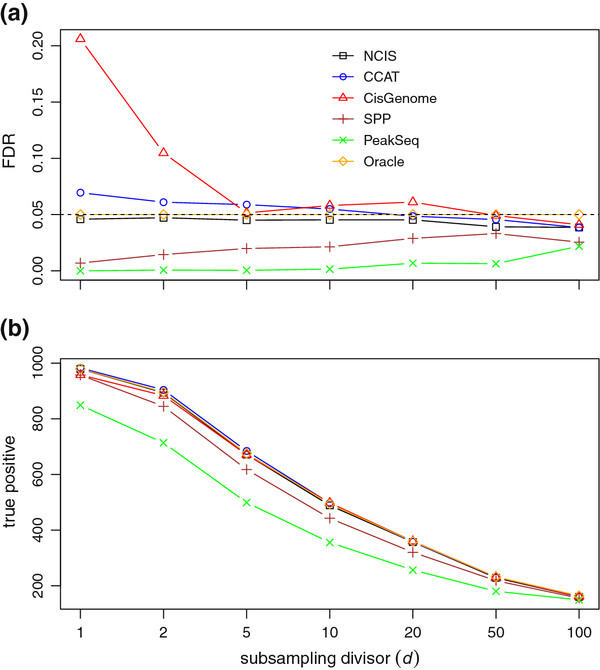
Results: We have developed a novel method for estimating the normalization factor between the ChIP and the control samples. Our method, named as NCIS (Normalization of ChIP-seq) can accommodate both low and high sequencing depth datasets. We compare statistical properties of NCIS against existing methods in a set of diverse simulation settings, where NCIS enjoys the best estimation precision. In addition, we illustrate the impact of the normalization factor in FDR control and show that NCIS leads to more power among methods that control FDR at nominal levels.
Conclusion: Our results indicate that the proper normalization between the ChIP and control samples is an important step in ChIP-seq analysis in terms of power and error rate control. Our proposed method shows excellent statistical properties and is useful in the full range of ChIP-seq applications, especially with deeply sequenced data.
Figures
Similar articles
-
Is this the right normalization? A diagnostic tool for ChIP-seq normalization.BMC Bioinformatics. 2015 May 9;16:150. doi: 10.1186/s12859-015-0579-z. BMC Bioinformatics. 2015. PMID: 25957089 Free PMC article.
-
dPeak: high resolution identification of transcription factor binding sites from PET and SET ChIP-Seq data.PLoS Comput Biol. 2013;9(10):e1003246. doi: 10.1371/journal.pcbi.1003246. Epub 2013 Oct 17. PLoS Comput Biol. 2013. PMID: 24146601 Free PMC article.
-
Role of ChIP-seq in the discovery of transcription factor binding sites, differential gene regulation mechanism, epigenetic marks and beyond.Cell Cycle. 2014;13(18):2847-52. doi: 10.4161/15384101.2014.949201. Cell Cycle. 2014. PMID: 25486472 Free PMC article. Review.
-
MACE: model based analysis of ChIP-exo.Nucleic Acids Res. 2014 Nov 10;42(20):e156. doi: 10.1093/nar/gku846. Epub 2014 Sep 23. Nucleic Acids Res. 2014. PMID: 25249628 Free PMC article.
-
ChIP-seq in studying epigenetic mechanisms of disease and promoting precision medicine: progresses and future directions.Epigenomics. 2016 Sep;8(9):1239-58. doi: 10.2217/epi-2016-0053. Epub 2016 Jun 20. Epigenomics. 2016. PMID: 27319740 Review.
Cited by
-
JMnorm: a novel joint multi-feature normalization method for integrative and comparative epigenomics.Nucleic Acids Res. 2024 Jan 25;52(2):e11. doi: 10.1093/nar/gkad1146. Nucleic Acids Res. 2024. PMID: 38055833 Free PMC article.
-
The Cell Type-Specific 5hmC Landscape and Dynamics of Healthy Human Hematopoiesis and TET2-Mutant Preleukemia.Blood Cancer Discov. 2022 Jul 6;3(4):346-367. doi: 10.1158/2643-3230.BCD-21-0143. Blood Cancer Discov. 2022. PMID: 35532363 Free PMC article.
-
S3norm: simultaneous normalization of sequencing depth and signal-to-noise ratio in epigenomic data.Nucleic Acids Res. 2020 May 7;48(8):e43. doi: 10.1093/nar/gkaa105. Nucleic Acids Res. 2020. PMID: 32086521 Free PMC article.
-
Software for rapid time dependent ChIP-sequencing analysis (TDCA).BMC Bioinformatics. 2017 Nov 25;18(1):521. doi: 10.1186/s12859-017-1936-x. BMC Bioinformatics. 2017. PMID: 29178831 Free PMC article.
-
The location and development of Replicon Cluster Domains in early replicating DNA.Wellcome Open Res. 2023 Aug 22;8:158. doi: 10.12688/wellcomeopenres.18742.2. eCollection 2023. Wellcome Open Res. 2023. PMID: 37766844 Free PMC article.
References
-
- Ramagopalan S, Heger A, Berlanga A, Maugeri N, Lincoln M, Burrell A, Handunnetthi L, Handel A, Disanto G, Orton S. A ChIP-seq defined genome-wide map of vitamin D receptor binding: Associations with disease and evolution. Genome Res. 2010;20(10):1352. doi: 10.1101/gr.107920.110. - DOI - PMC - PubMed
Publication types
MeSH terms
Substances
Grants and funding
LinkOut - more resources
Full Text Sources
Other Literature Sources
Molecular Biology Databases
