. 2012 Sep;18(9):1407-12.
doi: 10.1038/nm.2885.

Neutrophils mediate insulin resistance in mice fed a high-fat diet through secreted elastase

Affiliations

Neutrophils mediate insulin resistance in mice fed a high-fat diet through secreted elastase

Saswata Talukdar et al. Nat Med. 2012 Sep.

Abstract

Chronic low-grade adipose tissue and liver inflammation is a major cause of systemic insulin resistance and is a key component of the low degree of insulin sensitivity that exists in obesity and type 2 diabetes. Immune cells, such as macrophages, T cells, B cells, mast cells and eosinophils, have all been implicated as having a role in this process. Neutrophils are typically the first immune cells to respond to inflammation and can exacerbate the chronic inflammatory state by helping to recruit macrophages and by interacting with antigen-presenting cells. Neutrophils secrete several proteases, one of which is neutrophil elastase, which can promote inflammatory responses in several disease models. Here we show that treatment of hepatocytes with neutrophil elastase causes cellular insulin resistance and that deletion of neutrophil elastase in high-fat-diet–induced obese (DIO) mice leads to less tissue inflammation that is associated with lower adipose tissue neutrophil and macrophage content. These changes are accompanied by improved glucose tolerance and increased insulin sensitivity. Taken together, we show that neutrophils can be added to the extensive repertoire of immune cells that participate in inflammation-induced metabolic disease.


Figures
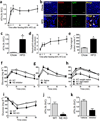
Figure 1
Figure 1. Neutophils infiltrate eWAT in HFD mice, and ablation of neutrophil elastase improves insulin sensitivity in HFD–fed obese mice
(a) Stromal vascular cells (SVCs) from epididymal white adipose tissue (eWAT) stained with Cd11b and Ly6g double positive, F4/80 and Cd11c negative cells analyzed by FACS. n = 3 – 4 mice per time point. (b) Adipose tissue from C57BL/6J mice on chow and 60% high fat diet (HFD) stained with caveolin, Ly6g and Cd11b. The merged Ly6g and Cd11b double positive (yellow) cells indicated by white arrows are adipose tissue neutrophils (ATNs). Scale bar indicates 100 µm. (c) FACS analyses showing ATN content (Ly6g/Cd11b double positive, F4/80 and Cd11c negative cells as % of SVCs) in 4 month old C57Bl/6J mice on chow and 20 week old mice fed HFD for 12 weeks. * indicates significance at p<0.05 using two–way ANOVA and Bonferroni post–test. (d) mRNA abundance of NE in eWAT of C57Bl6/J mice, normalized to RNA PolII. (e) NE activity in eWAT of male C57Bl/6J mice fed chow, or 60% HFD for 12 weeks. n = 5 for chow, and n = 8 for HFD. p value as indicated using two–way ANOVA and Bonferroni post–test. (f) GTT on 7 h fasted C57BL/6J mice fed 60% HFD for 12 weeks, that were orally administered with vehicle and NE inhibitor (GW311616A) every day, for 2 weeks. n = 12 for vehicle, and n = 8 for drug treated group. * indicates significance at p<0.05 using two–way ANOVA and Bonferroni post–test. (g) GTT in 5 month old C57Bl/6J mice on normal chow administered 1 mg kg−1 recombinant mouse NE for 7 days. n = 10 mice per group. * indicates significance at p<0.05 using two–way ANOVA and Bonferroni post–test. (h) IP–GTT on 7 h fasted animals fed HFD for 10 weeks, using 1 mg kg−1 glucose, on WT weight, and age–matched WT mice with NE KO mice. The age matched mice are C57BL/6J mice obtained from JAX whose date of birth is matched with the NE KO mice. Weight matched mice are C57BL/6J mice obtained from JAX, that are approximately two and a half weeks younger than WT age matched, and NE KO mice. All WT mice were purchased at 6–7 weeks of age, acclimatized in our vivarium for 1–2 weeks and started on HFD at 8 weeks of age. n = 8 – 10 mice per group. * indicates significance at p<0.05 using two–way ANOVA and Bonferroni post–test. (i) IP–ITT using 0.6 U kg−1 insulin in weight matched WT and NE KO mice fed HFD for 6 weeks. n = 8 – 10 mice per group. * indicates significance at p<0.05 using two–way ANOVA and Bonferroni post–test. (j) FACS showing ATNs in WT and NE KO mice on HFD for 12 weeks. * indicates significance at p<0.05 using two–way ANOVA and Bonferroni post–test. (k) FACS showing ATNs in 12 week HFD mice treated with vehicle of the NE inhibitor (GW311616A) for 2 weeks. * indicates significance at p<0.05 using two–way ANOVA and Bonferroni post–test.
Figure 2
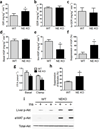
Figure 2. Increased insulin sensitivity in NE KO mice
Hyperinsulinemic–euglycemic clamp studies in WT and NE KO mice on HFD for 10–11 weeks. (a) Glucose infusion rate, (b) total glucose disposal rate, (c) insulin–stimulated glucose disposal rate, (d) basal hepatic glucose production, (e) clamp hepatic glucose production, (f) percent suppression of hepatic glucose production, (g) Free fatty acids (FFAs) 6 h fasted WT and NE KO mice (Basal), and at the end of the clamp procedure (clamp). * indicates significance at p<0.05 using two–way ANOVA and Bonferroni post–test. (h) Percent suppression of lipolysis was calculated from (g). * indicates significance at p<0.05 using Student’s t test. * indicates significance at p<0.05 using two–way ANOVA and Bonferroni post–test. (i) Acute insulin response in WT and NE KO mice using 0.35 U kg–1 insulin injected via inferior vena cava. Liver isolated at basal (−Ins) and 3 min (+Ins), adipose tissue (eWAT) harvested at basal (−Ins) and 7 min (+Ins). Western blots showing liver and adipose tissue phospho– and total– Akt.
Figure 3
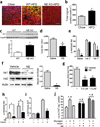
Figure 3. Neutrophils infiltrate the liver in HFD mice and cause impaired insulin signaling via degradation of Irs1
(a) Immunohistochemistry (IHC) on liver sections obtained from 4 month old chow, 20 week old WT and NE KO mice fed HFD for 12 weeks. Red color indicates lipid content in hepatocytes, stained with BODIPY, blue indicates nuclei stained with DAPI and green indicates neutrophils, stained with Ly6g (1A8). Scale bar indicates 50 µm. (b) NE activity in liver of male C57Bl/6J mice fed chow, or 60% HFD for 12 weeks. n = 5 for chow, and n = 8 for HFD. * indicates significance at p<0.05 using two–way ANOVA and Bonferroni post–test. (c) Western blots for total Irs1 and Hsp90 from WT and NE KO mice on HFD for 12 weeks. Densitometry analysis was performed and represented below the blot. * indicates significance at p<0.05. (d) Liver Irs1 quantitated by MSD analyses from fasted 4–month old C57Bl6/J mice on chow diet. Mice were injected with saline or recombinant mouse NE. Tissues were harvested 2 h after NE injection. (e) Acute insulin response in 4 month old C57Bl/6J mice on chow treated with recombinant mouse NE. A submaximal insulin dose (0.1 U–1 kg) was used and liver samples were obtained at the indicated times points. MSD was used to analyze phospho– and total–Akt. * indicates significance at p<0.05 using two–way ANOVA and Bonferroni post–test. (f) Primary mouse hepatocytes were treated with recombinant mouse NE for 4 h and protein was harvested and western blots were performed according to standard protocol. * indicates significance at p<0.05 using two–way ANOVA and Bonferroni post–test. (g) Cryopreserved human hepatocytes were treated with purified human NE for 6 h. Representative figure from at least 3 independent experiments. * indicates significance at p<0.05 using two–way ANOVA and Bonferroni post–test. (h) Primary mouse hepatocytes were treated with NE for 4 h and spiked with insulin for 5 min to obtain insulin induction. Figure shows quantitation of western blots from at least 3 independent experiments performed in duplicate. * indicates significance at p<0.05 using two–way ANOVA and Bonferroni post–test. (i) Primary human hepatocytes were treated with human NE for 6 h and spiked with insulin for 5 min to obtain insulin induction. Protein was harvested and MSD was used to determine human phospho– and total–AKT according to manufacturer’s protocol. Figure show quantitation data from least 2 independent experiments performed in triplicate. * indicates significance at p<0.05 using two–way ANOVA and Bonferroni post–test. (j) Representative glucose output assay in primary mouse hepatocytes from at least 3 independent experiments performed in duplicate or triplicate. *, significantly higher than basal, and #, significantly higher than insulin + glucagon. Significance is at p<0.05 using Student’s t–test.
Figure 4
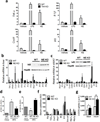
Figure 4. NE KO mice have decreased inflammatory tone
(a) qPCR of the indicated genes from IP–Macs harvested from WT and Tlr4 KO mice, treated with vehicle, LPS and recombinant mouse NE. *, represents significantly higher than all other treatment groups, and #, represents significantly lower than WT LPS, and significantly higher than all other treatment groups. * significance at p<0.05 using Student’s t test. (b) qPCR analysis on inflammatory gene expression in liver, and (c) adipose tissue, from WT and NE KO mice on HFD. Western blot for liver IκB and Hsp90 (b) inset, and adipose IκB and Hsp90 (c) inset. * indicates significance at p<0.05 using Student’s t test. (d) SVCs from eWAT stained with F4/80, Cd11b, and Cd11c and analyzed by FACS. Cells that are triple positive for all three markers are referred to as ATM1, and (e) cells that are positive for both F4/80 and Cd11b and negative for Cd11c are referred to as ATM2. * indicates significance at p<0.05 using two–way ANOVA and Bonferroni post–test. (f) Serum cytokines measured using the Millipore Luminex assay from WT and NE KO mice on HFD. * indicates significance at p<0.05 using Student’s t test. (g) Glucose uptake in eWAT explants harvested from WT and NE KO mice and incubated ex vivo in the absence and presence of insulin, followed by measurement of 2–deoxyglucose (2–DOG) uptake. * indicates significance at p<0.05 using two–way ANOVA and Bonferroni post–test.

Similar articles

Cited by

References

    1. Olefsky JM, Glass CK. Macrophages, inflammation, and insulin resistance. Annu Rev Physiol. 2010;72:219–246. - PubMed
    1. Gregor MF, Hotamisligil GS. Inflammatory mechanisms in obesity. Annu Rev Immunol. 2011;29:415–445. - PubMed
    1. Nishimura S, et al. CD8+ effector T cells contribute to macrophage recruitment and adipose tissue inflammation in obesity. Nat Med. 2009;15:914–920. - PubMed
    1. Winer S, et al. Normalization of obesity–associated insulin resistance through immunotherapy. Nat Med. 2009;15:921–929. - PMC - PubMed
    1. Feuerer M, et al. Lean, but not obese, fat is enriched for a unique population of regulatory T cells that affect metabolic parameters. Nat Med. 2009;15:930–939. - PMC - PubMed

Publication types

Substances