
Identification of regulators of polyploidization presents therapeutic targets for treatment of AMKL

Qiang Wen et al. Cell. .

Abstract

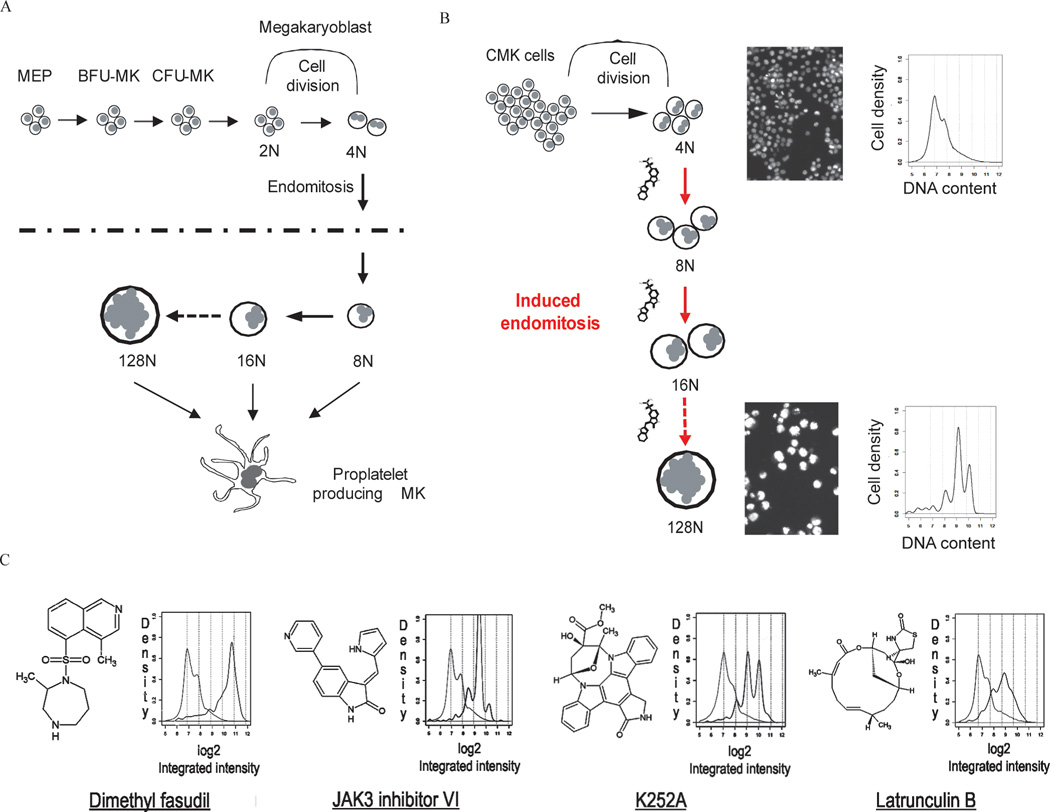
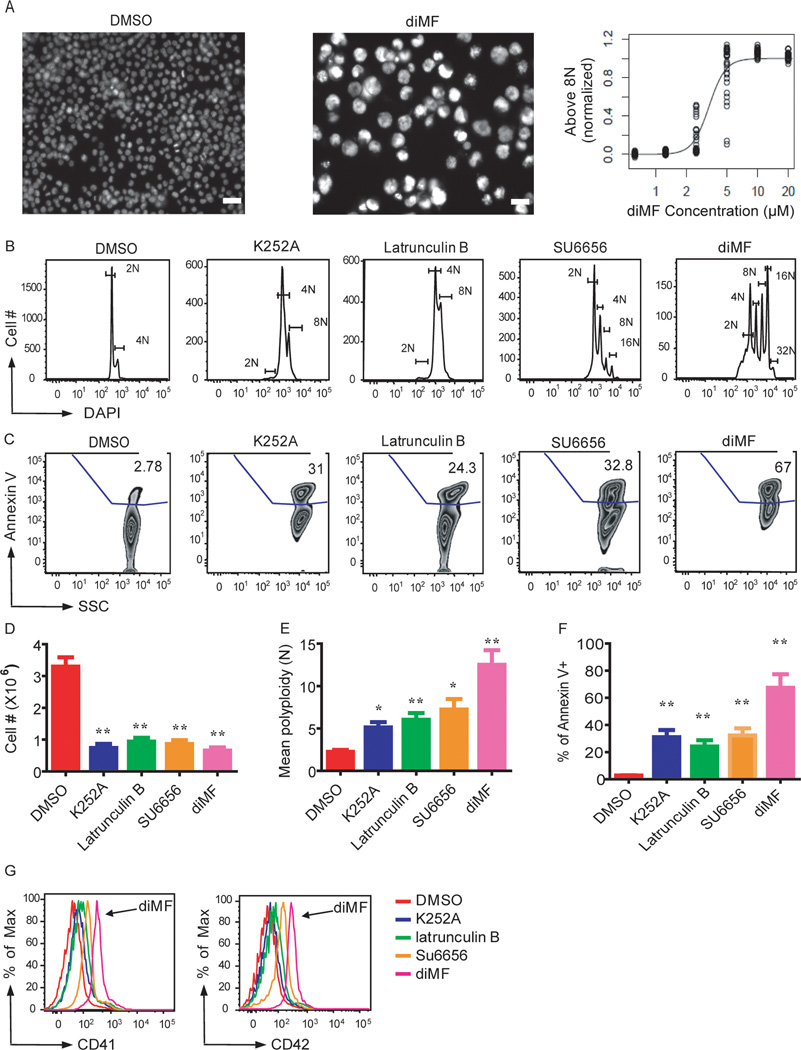
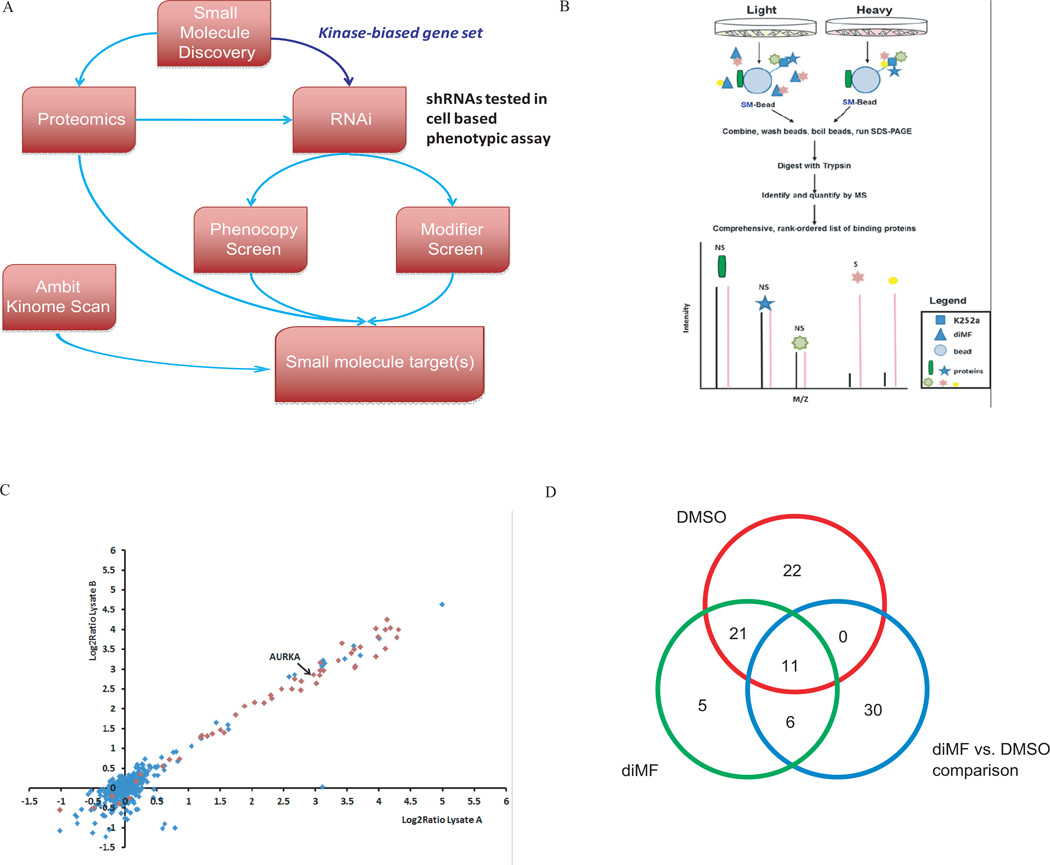
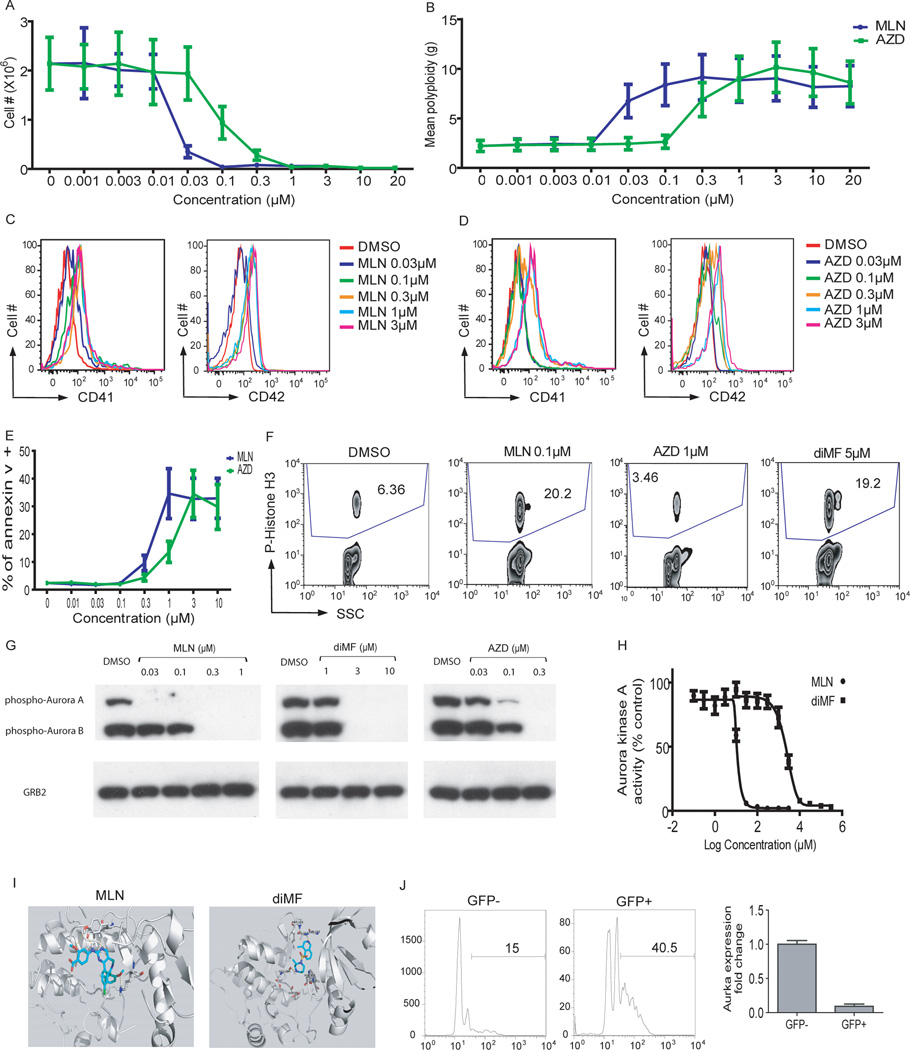
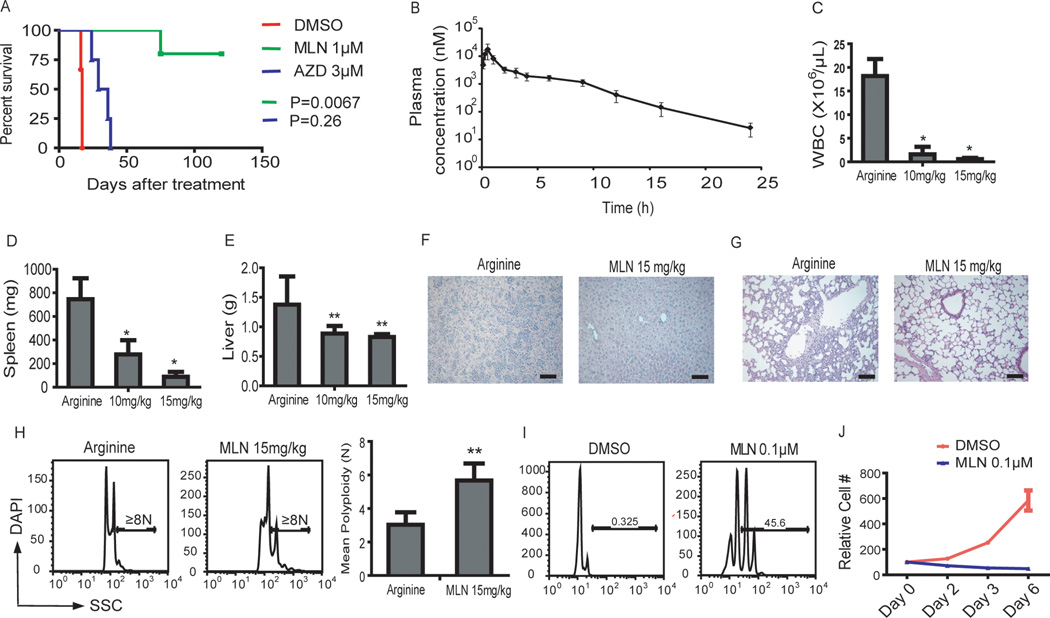
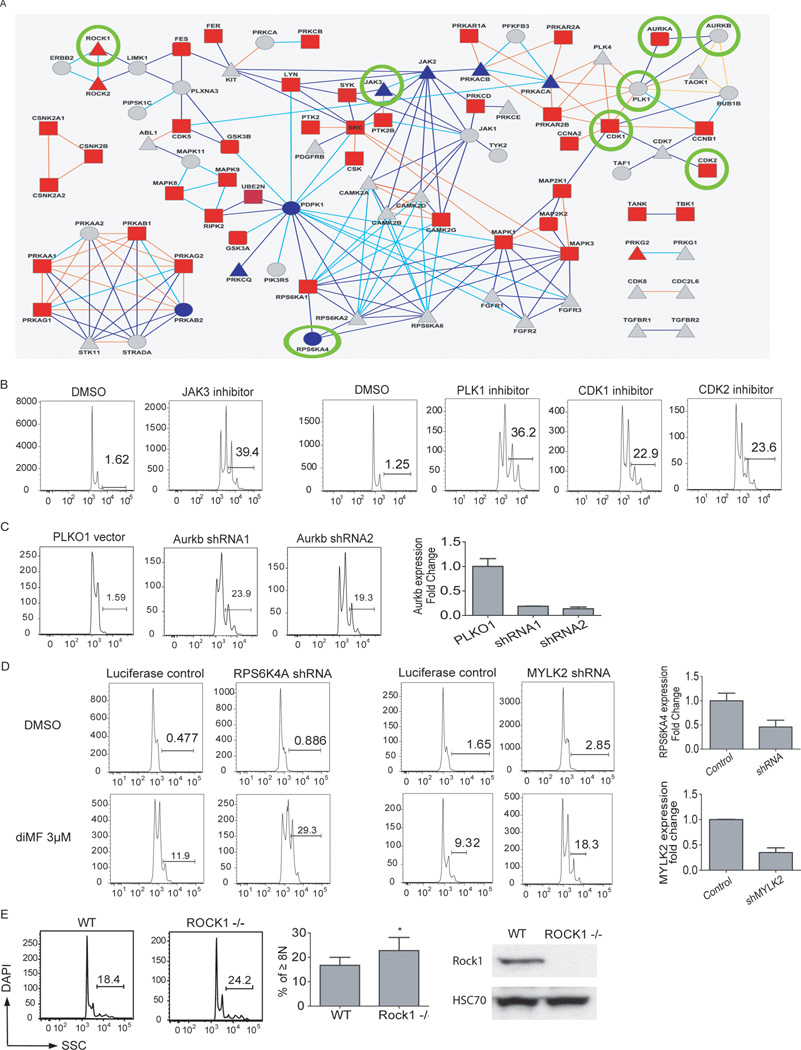
The mechanism by which cells decide to skip mitosis to become polyploid is largely undefined. Here we used a high-content image-based screen to identify small-molecule probes that induce polyploidization of megakaryocytic leukemia cells and serve as perturbagens to help understand this process. Our study implicates five networks of kinases that regulate the switch to polyploidy. Moreover, we find that dimethylfasudil (diMF, H-1152P) selectively increased polyploidization, mature cell-surface marker expression, and apoptosis of malignant megakaryocytes. An integrated target identification approach employing proteomic and shRNA screening revealed that a major target of diMF is Aurora kinase A (AURKA). We further find that MLN8237 (Alisertib), a selective inhibitor of AURKA, induced polyploidization and expression of mature megakaryocyte markers in acute megakaryocytic leukemia (AMKL) blasts and displayed potent anti-AMKL activity in vivo. Our findings provide a rationale to support clinical trials of MLN8237 and other inducers of polyploidization and differentiation in AMKL.


Figures

Figure 1
Figure 1. Cell-based, high-content imaging screen for compounds that induce megakaryocyte polyploidization
(A) Schematic of megakaryocyte development. MEP, megakaryocyte-erythroid progenitor; BFU-MK, burst-forming unit-megakaryocyte; CFU-MK, colony-forming unit megakaryocyte. (B) Schematic of the image-based high-throughput screen to identify small molecules that induce polyploidization of leukemic megakaryocytes. (C) Structures of representative hit compounds and their effects on megakaryocyte polyploidization. Structures (left) and histograms of DNA content as measured by CellProfiler (right) are shown. Light gray lines depict DMSO control and black lines depict ploidy states of cells cultured with the respective compounds.
Figure 2
Figure 2. Lead compounds induce polyploidization, expression of differentiation markers, and apoptosis of a human megakaryocytic cell line
(A) Left, images of Hoechst-stained CMK cells treated with DMSO or diMF. Right, EC50 determination for diMF induction of polyploidization > 8N. Scale bar: 50 µm. (B–G) K252a (5 µM), latrunculin B (5 µM), SU6656 (4 µM) and diMF (5 µM) induced polyploidization (B,E), apoptosis (C,F), proliferative arrest (D) and expression of CD41 and CD42 (G) in CMK cells 72 hr after treatment. Representative flow cytometry plots are shown. Bar graphs depict mean ± SD of two independent experiments conducted in triplicate; * p<0.05, ** p<0.01
Figure 3
Figure 3. diMF displays anti-leukemic activity both in vitro and in vivo
(A,B) diMF-induced polyploidization (A) and expression of CD41 and CD42 (B) in 6133/MPL cells 48 hr after treatment. Data are representative of two independent experiments. (C) Transplantation of 6133/MPL cells causes AMKL in sub-lethally irradiated recipient mice. H&E-stained spleen sections revealed massive infiltration of tumor cells in transplanted mice, but not control mice. Scale bar: 50 µm. (D) Survival curve of mice transplanted with 6133/MPL cells pretreated with vehicle or 10 µM diMF for 24 hr. N=7 mice per group; p=0.0002. (E) Measurement of drug concentration in plasma after a single dose of diMF. C57Bl/6 mice were dosed orally with 66 mg/kg of diMF, and plasma concentrations of the drug were assessed at multiple time points post-treatment; n=3 animals per time point. The insert depicts decay over 2 hr. (F) Survival curve of mice transplanted with 1 million 6133/MPL cells and treated with vehicle or diMF at 33 or 66 mg/kg for 10 days, beginning two days after transplantation; n=7 mice per group. Results are representative of two independent experiments. (G) diMF induction of polyploidization of 6133/MPL cells in vivo. Forty-eight hr after transplantation, mice were fed vehicle or 66 mg/kg diMF by oral gavage twice a day for 3 days and the DNA content of the transplanted cells in bone marrow was evaluated by flow cytometry; n=3 animals per group. (H) diMF induced polyploidization of human non-DS-AMKL blasts. Human CD41+ non-DS-AMKL blasts from primary NSG recipients were treated with vehicle or 5 µM diMF for 6 days. (I, J, K) diMF reduced tumor burden and induced polyploidization of NSG mice transplanted with human non-DS-AMKL blasts from primary NSG recipients. Secondary NSG recipients were treated with vehicle or diMF at 30 or 60 mg/kg for 10 days. diMF reduced human CD41+ cells in spleen (I), peripheral blood (J), and induced polyploidization (K) of human CD41+ cells in the spleen. (L) diMF inhibition of DS-AMKL blast colony formation. Bone marrow specimens from pediatric patients with DS-AMKL were cultured in Megacult-C media with THPO and either DMSO or 5 µM diMF for 10–12 days. Representative images of anti-CD41 antibody stained colonies are shown; scale bar: 100 µm. Bar graph depicts the mean ± SD of relative colony numbers following treatment; * p<0.05.
Figure 4
Figure 4. An integrated target ID approach identifies Aurora kinase A as a target of diMF in AMKL
(A) Schematic representation of the integrated target identification workflow. CMK cells were transduced with shRNAs targeting the human kinome and the effects of knockdown were studied in the presence of DMSO (phenocopy screen) or a minimally effective dose of diMF at 1 µM (modifier screen). (B) Quantitative proteomic strategy for identification of specific diMF-protein interactions. Proteins in cell populations were fully metabolically labeled with light (yellow) and heavy amino acids lysine and arginine (red) using SILAC methodology. Cell lysates were incubated either with K252a-loaded beads (K252a-Beads) and excess soluble diMF competitor or K252a-Beads alone. Proteins interacting directly with diMF or via secondary and/or higher-order interactions (marked “S” for specific) were enriched in the heavy state over the light and identified with differential ratios in the mass spectrometer. Nonspecific (via binding to the bead) or K252a (NS) interactions of proteins were enriched equally in both states and have ratios close to unity. (C) Identification of significant targets of diMF using affinity proteomics with SILAC. Scatter plot of two replicate experiments of diMF at 50-fold excess over K252a on beads. Each data point is a single protein with kinases (Manning et al., 2002), represented as red diamonds and blue diamonds denoting non-kinases. Six hundred ninety-eight proteins were identified and quantified in at least three experiments, resulting in 68 proteins with a combined q-value < 0.05. (D) Venn diagram of genes scored as hits in each type of comparisons.
Figure 5
Figure 5. Inhibition of Aurora kinase A phenocopies diMF
(A–E) MLN8237 and AZD1152-HQPA induced proliferation arrest (A), polyploidization (B), expression of CD41 and CD42 (C,D), and apoptosis (E) in CMK cells 72 hr after treatment. Data are representative of two experiments conducted in duplicate. Line graphs depict mean ± SD. (F) MLN8237 and diMF increased the phosphorylation of histone H3, while AZD1152-HQPA decreased its levels. (G) MLN8237, AZD1152-HQPA, and diMF differentially inhibited phosphorylation of Aurora kinases. CMK cells were incubated with 0.1 µM paclitaxel for 18 hr, then DMSO, MLN8237, AZD1152-HQPA, or diMF was added and incubated for 2 hr. The degree of phosphorylation of the Aurora kinases in each sample was determined by Western blot. Treatment of cells with 1 µM AZD1152-HQPA also led to complete loss of phospho-AURKA and AURKB (data not shown). (H) MLN8237 and diMF inhibit AURKA. Purified Aurora kinase A was incubated with MLN8237 or diMF and the change of AURKA phosphorylation was determined by spectrophotometry. Data are representative of two experiments conducted in triplicate. (I) Docking studies were performed to evaluate the binding of MLN8237 and diMF to Aurora kinase A using Schrodinger software. Both MLN8237 and diMF showed a strong hydrogen-bond network with the hinge residues of AURKA. (J) Excision of Aurka leads to enhanced polyploidization of megakaryocytes. Bone marrow cells from Aurkaflox/flox mice were transduced with MIGR1-Cre-IRES-GFP and the cells were cultured in the presence of THPO for 72 hours. (Left) The DNA contents of CD41+ cells from GFP+ (Cre-expressing) or GFP- (without Cre expression) populations of the same culture are shown. (Right) The levels of Aurka mRNA in sorted GFP-positive or GFP-negative cells were assayed by qRT-PCR. Data are representative of two experiments.
Figure 6
Figure 6. MLN8237 shows anti-leukemic activity in vitro and in vivo
(A) Pretreatment with MLN8237, but not AZD1152-HQPA, impaired the ability of 6133/MPL cells to induce leukemia. 6133/MPL cells were incubated with 1 µM MLN8237 or 3 µM AZD1152-HQPA. One million live cells were transplanted to mice and survival of the mice was monitored. n=6 (DMSO), n=5 (MLN8237) and n= 4 (AZD1152-HQPA). MLN vs DMSO, p=0.067; AZD vs DMSO, p=0.26. (B) Measurement of drug concentration in plasma after a single dose of MLN8237. C57Bl/6 mice were dosed orally with 15 mg/kg of MLN8237, and plasma concentrations of the drug were assessed at different time points post-treatment; n=3 animals per time point. (C–G) MLN8237 reduced tumor load of 6133/MPL cell transplanted mice. Forty-eight hr after transplantation of 6133/MPL cells, mice were fed arginine (solvent for MLN8237) or MLN8237 at 10 and 15 mg/kg by oral gavage twice a day for 10 days. MLN8237 reduced white cell count in the peripheral blood (C) and decreased spleen and liver weight of transplanted mice (D,E). MLN8237 reduced infiltration of megakaryoblasts in the liver (F) and lung (G) in transplanted mice detected by H&E staining of tissue sections. (H) MLN8237 induced polyploidization of 6133/MPL cells in vivo. Forty-eight hr after transplantation of 6133/MPL cells, mice were given arginine or 15 mg/kg MLN8237 by oral gavage twice a day for 3 days and the DNA content of the transplanted cells in bone marrow was evaluated by flow cytometry. Left, representative flow plots. Right, Bar graph of mean ± SD; ** p<0.01. n=4 animals per group. (I, J) MLN8237 induced polyploidization and inhibited proliferation of human non DS-AMKL blasts. Human CD41+ non-DS-AMKL blasts isolated from primary NSG recipients were treated with DMSO or 0.1 µM MLN8237 for 6 days. Results are representative of two independent experiments in duplicate. Error bars represent mean ± SD; * p<0.05, ** p<0.01.
Fig 7
Fig 7. Pathways that regulate polyploidization of megakaryocytes
(A). Reactome analysis integrating the data from the KinomeScan, SILAC, and RNAi screen yielded 117 proteins that were mapped to 116 nodes and 194 connections. In the protein network, shapes of nodes correspond to the source; squares for SILAC, circles for RNAi, rounded squares for both SILAC and RNAi, triangles for Kinome scan only. Colors of the nodes correspond to false-discovery rate of SILAC ratio in the range 0.05 (red) – 1.0 (blue) or gray for proteins not detected by SILAC. Colors of connections correspond to the type of interaction: direct complex (orange), indirect complex (yellow), reaction (blue), neighboring reaction (cyan). Thick connections mark pairs of proteins not distinguished from each other by SILAC. Kinases that were validated in separate experiments are circled. (B–E). Validation of kinases in the network. (B) Induction of CMK polyploidization after 72 hours of treatment with JAK3 inhibitor VI (1 µM), PLK1 inhibitor (1 µM), CDK1 inhibitor (3 µM) and CDK2 inhibitor (3 µM) is shown. (C) Knockdown of Aurkb induced polyploidization of megakaryocytes. 6133/MPL cells were transduced with PLKO1 control vector or shRNA against Aurkb. (D) Knockdown of RPS6KA4 or MYLK2 sensitized CMK cells to diMF treatment. CMK cells transduced with luciferase control viruses or shRNAs against RPS6KA4 or MYLK2 were cultured with DMSO or diMF (3 µM) for 72 hr. The extent of gene knockdown as assessed by qRT-PCR is shown. Results are representative of two independent experiments performed in duplicate. (E) (Left) Megakaryocytes (CD41+) derived from the bone marrow of Rock1-null mice showed increased degree of polyploidization relative to megakaryocytes from their wild-type littermates. (Middle) Bar graphs depict the percentages of cells with DNA contents ≥8N. Error bars represent mean ± SD; * p<0.05, n=5 mice per group. (Right) Expression of ROCK1 was assessed by western blot in extracts from murine bone marrow mononuclear cells.

Similar articles

Cited by

References

    1. Bluteau D, Lordier L, Di Stefano A, Chang Y, Raslova H, Debili N, Vainchenker W. Regulation of megakaryocyte maturation and platelet formation. J Thromb Haemost. 2009;7(Suppl 1):227–234. - PubMed
    1. Carmena M, Earnshaw WC. The cellular geography of aurora kinases. Nat Rev Mol Cell Biol. 2003;4:842–854. - PubMed
    1. Carpenter AE, Jones TR, Lamprecht MR, Clarke C, Kang IH, Friman O, Guertin DA, Chang JH, Lindquist RA, Moffat J, et al. CellProfiler: image analysis software for identifying and quantifying cell phenotypes. Genome Biol. 2006;7:R100. - PMC - PubMed
    1. Cowley DO, Rivera-Perez JA, Schliekelman M, He YJ, Oliver TG, Lu L, O'Quinn R, Salmon ED, Magnuson T, Van Dyke T. Aurora-A kinase is essential for bipolar spindle formation and early development. Mol Cell Biol. 2009;29:1059–1071. - PMC - PubMed
    1. D'Alise AM, Amabile G, Iovino M, Di Giorgio FP, Bartiromo M, Sessa F, Villa F, Musacchio A, Cortese R. Reversine, a novel Aurora kinases inhibitor, inhibits colony formation of human acute myeloid leukemia cells. Mol Cancer Ther. 2008;7:1140–1149. - PubMed

Publication types

MeSH terms