. 2012 Aug 3;150(3):495-507.
doi: 10.1016/j.cell.2012.05.047.

The first five seconds in the life of a clathrin-coated pit

Affiliations

The first five seconds in the life of a clathrin-coated pit

Emanuele Cocucci et al. Cell. .

Abstract

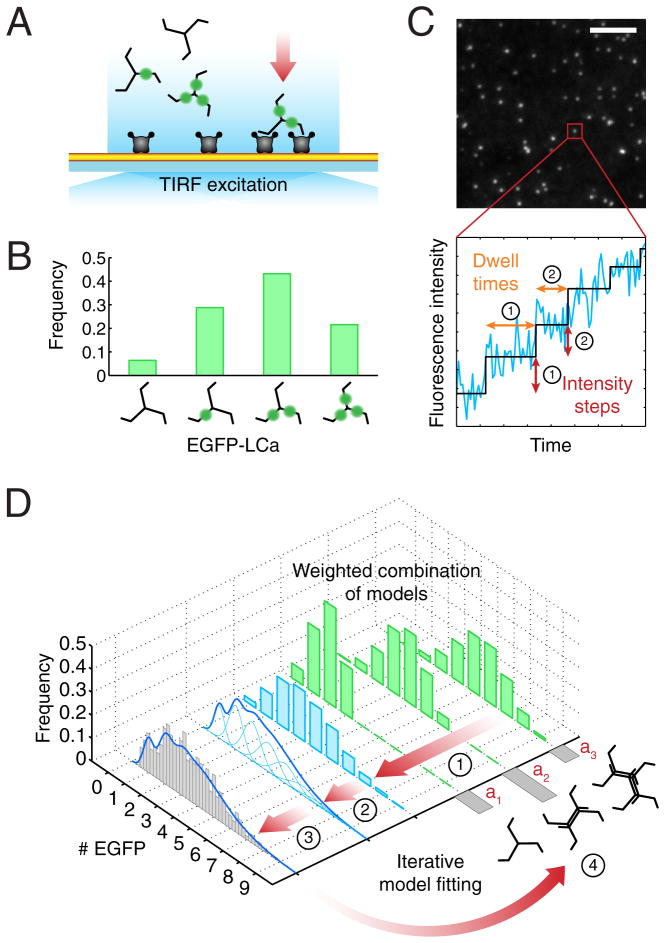
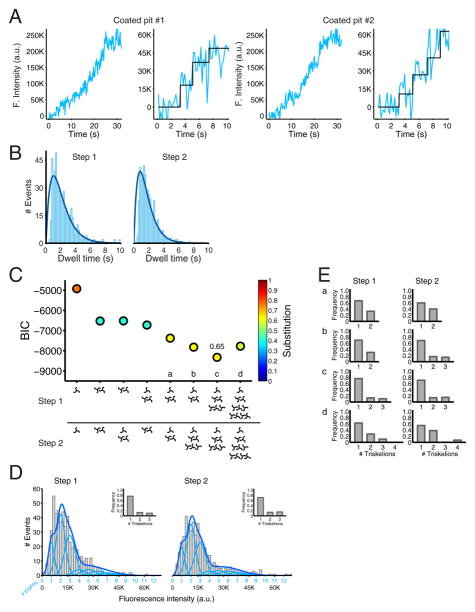
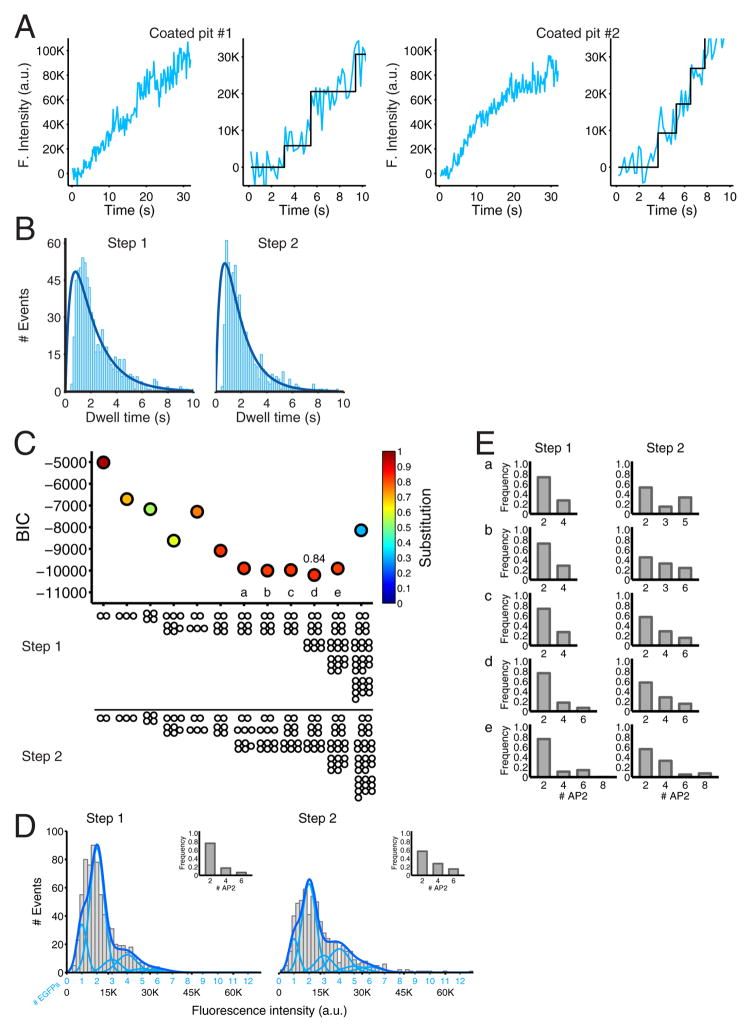
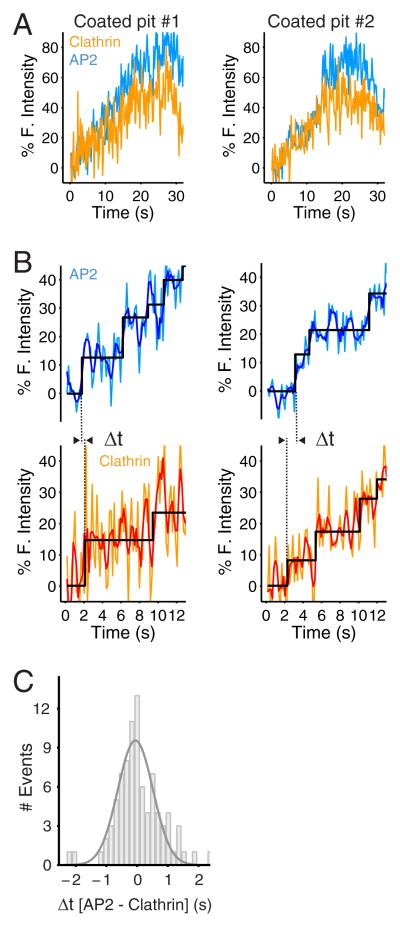
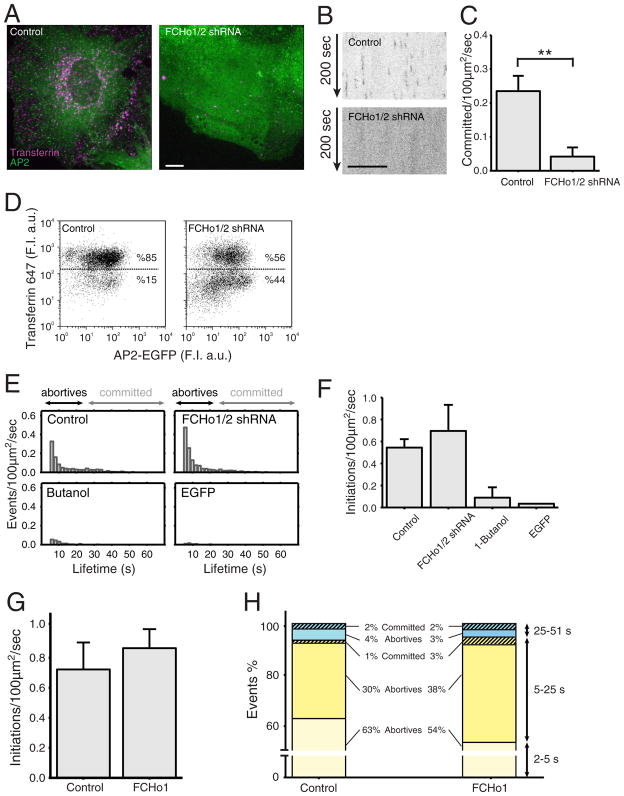
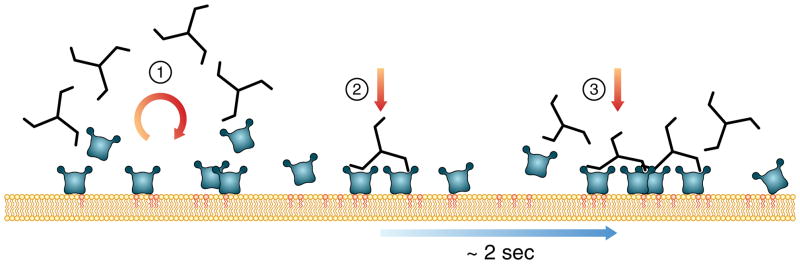
Coated pits assemble by growth of a clathrin lattice, which is linked by adaptors to the underlying membrane. How does this process start? We used live-cell TIRF imaging with single-molecule EGFP sensitivity and high temporal resolution to detect arrival of the clathrin triskelions and AP2 adaptors that initiate coat assembly. Unbiased object identification and trajectory tracking, together with a statistical model, yield the arrival times and numbers of individual proteins, as well as experimentally confirmed estimates of the extent of substitution of endogenous by expressed, fluorescently tagged proteins. Pits initiate by coordinated arrival of clathrin and AP2, which is usually detected as two sequential steps, each of one triskelion with two adaptors. PI-4,5-P2 is essential for initiation. The accessory proteins FCHo1/2 are not; instead, they are required for sustained growth. This objective picture of coated pit initiation also shows that methods outlined here will be broadly useful for studies of dynamic assemblies in living cells.


Figures

Figure 1
Figure 1. Schematic representation of the experimental setup and computational analysis
(A) TIRF imaging setup used for the experiments. This illustration shows an example of the recruitment of clathrin and AP2 adaptors to the plasma membrane (yellow) of a cell attached through the modified PEG support to a glass coverslip. Each clathrin triskelion contains three light chains that, depending on the expression level, might or not be replaced by ectopically expressed EGFP-LCa (green). The imaging experiments used here were designed to detect and track with single molecule sensitivity the arrival of the first clathrin (or AP2) molecules to the site of coated pit initiation. (B) Distribution of numbers of triskelions containing none, one, two or three EGFP-LCa molecules. Incorporation of EGFP-LCa follows a binomial distribution, shown in this example for a replacement of 60%. (C) Frame from a TIRF time-series showing fluorescent spots corresponding to coated pits labeled with clathrin EGFP-LCa. Scale bar: 5 μm. The fluorescence intensity trace (blue) corresponds to the profile from a single clathrin coated pit imaged during its initiation phase. A step-fitting function (black) was used to determine the fluorescence intensity and dwell time (duration) associated with the first two steps (indicated by their respective numbers); these values were combined to generate the fluorescence intensity distribution shown in the gray histogram of panel (D). (D) Data flow and computational analysis. Stage 1 shows the weighted contributions (green) for the calculated distribution of the number of EGFPs corresponding to different modes of triskelion recruitment (weights a1 to a3) constrained by the known molecular structures. For example, in the case of clathrin, EGFPs can only arrive in sets of one, two, three, etc. as part of one or more triskelions, each containing either zero, one, two or three EGFP-LCa, their relative amounts weighted by the extent of light chain replacement (panel B). Stage 2 shows the combined weighted distribution of numbers of EGFPs (blue) from stage 1 and the calculated EGFP distribution obtained by convolving the distribution of calculated EGFP molecules with Gaussians (light blue), for which the means and standard deviations were derived from the single-molecule calibration of fluorescence intensity. Calibrations are presented in Figure S1. Stage 3 corresponds to the comparison between the calculated EGFP intensity distribution (blue trace) and the experimentally determined EGFP measurements (gray). The number of clathrin triskelions recruited during a step is obtained by an iterative search process that minimizes the least-squares difference of the cumulative distribution functions between the experimentally and the calculated EGFP distribution values yielding the final weighted contribution and light chain substitution parameters (Stage 4).
Figure 2
Figure 2. Recruitment of clathrin during the initiation phase of coated pit formation detected with single molecule sensitivity
(A) Plot of the fluorescence intensity traces during the formation of two coated pits containing clathrin EGFP-LCa. The data were obtained from BSC1 cells stably expressing EGFP-LCa imaged by TIRF microscopy every 170 ms with an exposure of 30 ms per frame. The panels on the right are expanded traces corresponding to the first 10 s during the lifetime of the coated pits; they show the result of the fit (black) obtained by applying a step-fitting function to estimate the average fluorescence intensity and dwell time of the first two steps during the initiation phase of the pit. (B) Distribution of dwell times of the first and second steps of clathrin EGFP-LCa recruitment during the initiation phase of coated pit formation. Data from 537 coated pits in 5 cells. The dark blue line is a fit of a simple model based on two rate-limiting molecular steps. (C) Value of the Bayesian information criterion (BIC) used to determine the best fit between the experimental data and the recruitment models of clathrin indicated at the bottom. The quality of the fit increases with more negative BIC values (see Methods, (Schwarz, 1978)). Each point was color coded according to the calculated substitution level of endogenous light chain by the ectopically expressed EGFP-LCa. The relative contributions of triskelions in models a–d are presented in panel E. (D) The compiled distribution of net fluorescence intensities (fluorescence intensity for a given spot minus the fluorescence intensity of the background, in arbitrary units) of recruited clathrin EGFP-LCa was determined for the first and second steps during the initiation phase of all pits in the five cells analyzed (gray). The continuous fluorescence intensity signal (dark blue) is the sum of the relative contributions to the fluorescence signal by the incorporation of one, two, etc., EGFP molecules (light blue) that were obtained from the model with the best BIC score (panel C, c). For the first step, the model represents the arrival of a single triskelion in ~75 % of the events, and two and three triskelions in the remaining ~25 % (inset). For the second step, the model represents the arrival of one, two and three triskelions in ~70%, ~14 % and ~16 % of the events, respectively (inset). The calculated extent of endogenous light chain substitution for all cells with EGFP-LCa was 65%. (E) Arrival of triskelions to the first and second steps of the models a–d highlighted in panel C. The gray histograms show the relative contributions of triskelions recruited in the first and second steps of clathrin coated pit formation for the three models (a,b,d) with a BIC score closest to the best model (c). The analyses of the single cells are reported in Figure S2 for cells 1–5.
Figure 3
Figure 3. Recruitment of AP2 during the initiation phase of coated pit formation detected with single molecule sensitivity
(A) Plot of the fluorescence intensity traces during the formation of two coated pits containing AP2 tagged with σ2-EGFP. The data were obtained from BSC1 cells stably expressing σ2-EGFP imaged by TIRF microscopy every 170 ms with an exposure of 30 ms per frame. The panels on the right are expanded traces corresponding to the first 10 s during the lifetime of the coated pits; they show the result of the fit (black) obtained by applying a step-fitting function to estimate the average fluorescence intensity and dwell time of the first two steps during the initiation phase of the pit. (B) Distribution of dwell times of the first and second steps of AP2 σ2-EGFP recruited during the initiation phase of coated pit formation. Data from 698 pits in 6 cells. The dark blue line is a fit of a simple model based on two rate-limiting molecular steps. (C) Value of the Bayesian information criterion (BIC) used to determine the best fit between the experimental data and the recruitment models of AP2 indicated at the bottom. The quality of the fit increases with more negative BIC values. Each point was color coded according to the calculated substitution level of endogenous σ2 by the ectopically expressed σ2-EGFP. The relative contributions of AP2 recruitment in models a–e are presented in panel E. (D) The compiled distribution of net fluorescence intensities (fluorescence intensity for a given spot minus the fluorescence intensity of the background, in arbitrary units) of recruited AP2 σ2-EGFP was determined for the first and second steps during the initiation phase of all pits in the six analyzed cells (gray). The continuous fluorescence intensity signal (dark blue) is the sum of the relative contributions to the fluorescence signal by the incorporation of one, two, etc., EGFP molecules (light blue) that were obtained from the model with the best BIC score (panel C, d). For the first step, the model represents the arrival of two AP2 in ~75 % of the events, and four and six AP2 in the remaining ~25 % (inset). For the second step, the model represents the arrival of two, four and six AP2 in ~55%, ~30 % and ~15 % of the events, respectively (inset). The calculated extent of endogenous σ2 substitution with σ2-EGFP was 84% for all cells. (E) Arrival of AP2s to the first and second steps of the models a–e highlighted in panel C. The gray histograms show the relative contributions of AP2 recruited in the first and second steps of clathrin coated pit formation for the four models (a–c,e) with a BIC score closest to the best model (d). The analyses of the single cells are reported in Figure S5 for cells 1–6.
Figure 4
Figure 4. Recruitment of clathrin and AP2 during the initiation phase of the same coated pit
(A) Fluorescence intensity traces corresponding to the recruitment of clathrin and AP2 during the formation of two coated pits containing clathrin mCherry-LCa and σ2-EGFP. The data were obtained from BSC1 cells stably expressing σ2-EGFP and transiently expressing mCherry-LCa. The cells were imaged by TIRF microscopy with the dual view setup every 170 ms with simultaneous excitation of mCherry and EGFP using exposures of 30 ms per frame. The traces correspond to the first 30 s during the lifetime of the coated pits. (B) The expanded traces show the raw fluorescence signals (light blue, light orange), the corresponding smoothened plots (dark blue and red) obtain with a running average filter (window size = 3). The fitted steps (black) obtained by applying the step-fitting function to the raw signals, were then used to measure the dwell time of the first step and to determine the difference in the arrival time (Δt) of AP2 and clathrin during the first step. (C) Distribution of the difference in the arrival time (Δt) of clathrin mCherry-LCa and AP2 σ2-EGFP during the initiation step of 83 coated pits from 5 cells.
Figure 5
Figure 5. Effect of FCHo proteins on coated pit initiation and formation
(A) Uptake of Alexa 647 transferrin (magenta) by BSC1 cells stably expressing σ2-EGFP (green) in the presence and absence of FCHo1 and FCHo2. Depletion of FCHo1/2 was obtained after a 4-day incubation with lentivirus encoding short hairpin interfering RNA sequences specific for FCHo1 and FCHo2 (FCHo1/2 shRNA). Cells were incubated for 10 min at 37 °C with 10 μg/ml Alexa 647 transferrin and then imaged in 3D using spinning disk confocal microscopy. The representative images correspond to maximum z-projections from a stack of 35 imaging planes spaced 0.5 μm. Scale bar: 10 μm, for both panels. (B) Representative kymographs from time series from the bottom attached surface of BSC1 cells obtained by spinning disk confocal microscopy. The cells stably expressing σ2-EGFP were imaged in the presence (top) or absence (bottom) of FCHo1/2. Time series were obtained 4 days after treatment of the cells with lentivirus encoding scrambled or short hairpin interfering RNA sequences specific for FCHo1 and FCHo2. Scale bar: 10 μm, for both panels. (C) Distributions of the numbers of coated pits longer than 25 s forming in the presence (0.23 +/− 0.045 committed pits/100 μm2/s; total number of pits = 3275) and absence (0.042 +/− 0.027; total number of pits = 1139) of FCHo1/2. Error bars: cell-to-cell standard deviation; **: p<10−4, t-test. Data from 5 cells for each condition. (D) FACS analysis to follow the uptake of Alexa 647 transferrin by BSC1 cells stably expressing σ2-EGFP in the presence (left) and absence (right) of FCHo1/2. (E) Number of coated pit events detected by TIRF in the presence and absence of FCHo1/2, respectively. Time series were obtained by imaging every 170 ms with an exposure of 30 ms per frame. The number of committed pits (>25 s) was underrepresented because the length of the time series used was 1 min in duration. (F) Distributions of fluorescent spots representing the number of initiation events with duration longer than 5 s detected by TIRF microscopy in BSC1 cells stably expressing σ2-GFP; 51 s time series were obtained by imaging every 170 ms with an exposure of 30 ms per frame. The data were obtained from control cells expressing normal amounts of FCHo1 and FCHo2 (0.544 +/− 0.076 initiations/100 μm2/s; N = 4 cells), from cells depleted of FCHo1 and FCHo2 (0. 696 +/− 0.23; N = 3 cells), and from control cells briefly exposed to 1-butanol (0.089 +/− 0.094; N = 3 cells). The last bar shows the distribution of fluorescent spots detected at the plasma membrane of cells expressing soluble, cytosolic monomeric EGFP (0.034; N = 1 cell). (G) Distributions of the numbers of fluorescent spots representing initiation events (> 2 s) detected by TIRF microscopy in BSC1 cells stably expressing σ2-GFP alone or together with transiently expressed FCHo1. We recorded 51 s time series by imaging every 170 ms with an exposure of 30 ms per frame. The data were obtained both from control cells expressing normal amounts of FCHo1/2 (0.722 +/− 0.179; N = 5 cells) and from cells transiently expressing FCHo1 for three days (0.864 +/− 0.126; N = 5 cells). (H) The events detected in (G) were divided into three groups: those lasting 2–5 s, 5–25 s, and 25–51 s. The data are color coded to differentiate abortive (full color) from committed pits (striped), the later selected by their higher maximum fluorescence intensity.
Figure 6
Figure 6. Proposed model for recruitment of clathrin and AP2 during the first 5 seconds of coated pit formation
Schematic representation of the early events during initiation of coated pit formation. (1) AP2 binds weakly to PI-4,5-P2 contained in the plasma membrane, leading to rapid association and dissociation. Clathrin has no affinity for the membrane, and interactions between clathrin and a single AP2 are also too weak to form a stable complex. (2) The first recognizable event coordinated binding of a clathrin triskelion to two membrane-anchored AP2s; the two anchor points stabilize the resulting complex and increase its residence time at the membrane. (3) The increased residence time of the triskelion/AP2 complex results in the second resolvable event, incorporation of a further building block, typically consisting of one triskelion bound to two AP2s. In a small proportion of cases (~30%), the incorporation rate of a second triskelion/AP2 complex is faster than the temporal resolution of data acquisition (170 ms), resulting in the combined model of 70% one triskelion/2 AP2 + 30% 2 triskelions/4 AP2 in steps one and two. The accessory proteins FCHo1 and FCHo2 are not involved in the initial two steps of assembly.

Comment in

  • How vesicles put on their coat.
    Eisenstein M. Eisenstein M. Nat Methods. 2012 Oct;9(10):948. doi: 10.1038/nmeth.2192. Nat Methods. 2012. PMID: 23193582 No abstract available.

Similar articles

Cited by

References

    1. Antonescu CN, Aguet F, Danuser G, Schmid SL. Phosphatidylinositol-(4,5)-bisphosphate regulates clathrin-coated pit initiation, stabilization, and size. Mol Biol Cell. 2011;22:2588–2600. - PMC - PubMed
    1. Bocking T, Aguet F, Harrison SC, Kirchhausen T. Single-molecule analysis of a molecular disassemblase reveals the mechanism of Hsc70-driven clathrin uncoating. Nat Struct Mol Biol. 2011;18:295–301. - PMC - PubMed
    1. Boucrot E, Saffarian S, Massol R, Kirchhausen T, Ehrlich M. Role of lipids and actin in the formation of clathrin-coated pits. Exp Cell Res. 2006;312:4036–4048. - PMC - PubMed
    1. Boucrot E, Saffarian S, Zhang R, Kirchhausen T. Roles of AP-2 in clathrin-mediated endocytosis. PLoS One. 2010;5:e10597. - PMC - PubMed
    1. Boulant S, Kural C, Zeeh JC, Ubelmann F, Kirchhausen T. Actin dynamics counteract membrane tension during clathrin-mediated endocytosis. Nat Cell Biol 2011 - PMC - PubMed

Publication types

LinkOut - more resources