. 2012 Oct;86(20):11043-56.
doi: 10.1128/JVI.07101-11. Epub 2012 Aug 1.

Hepatitis C virus (HCV) induces formation of stress granules whose proteins regulate HCV RNA replication and virus assembly and egress

Affiliations

Hepatitis C virus (HCV) induces formation of stress granules whose proteins regulate HCV RNA replication and virus assembly and egress

Urtzi Garaigorta et al. J Virol. 2012 Oct.

Abstract

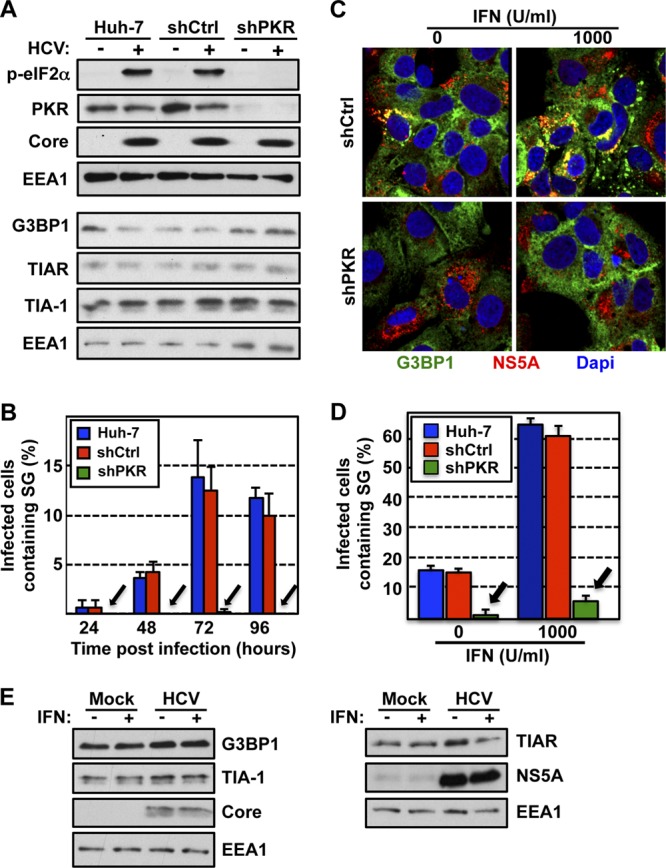
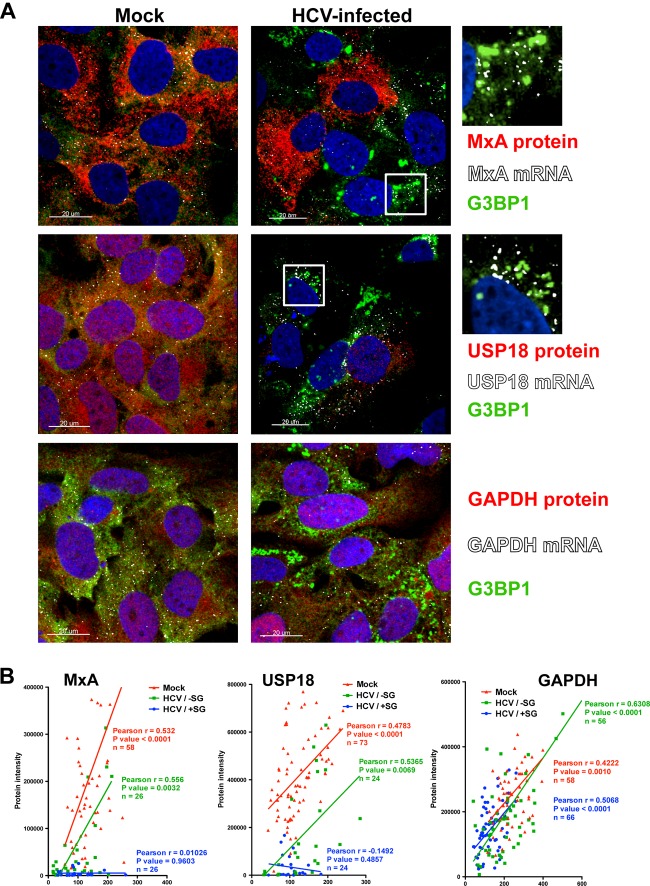
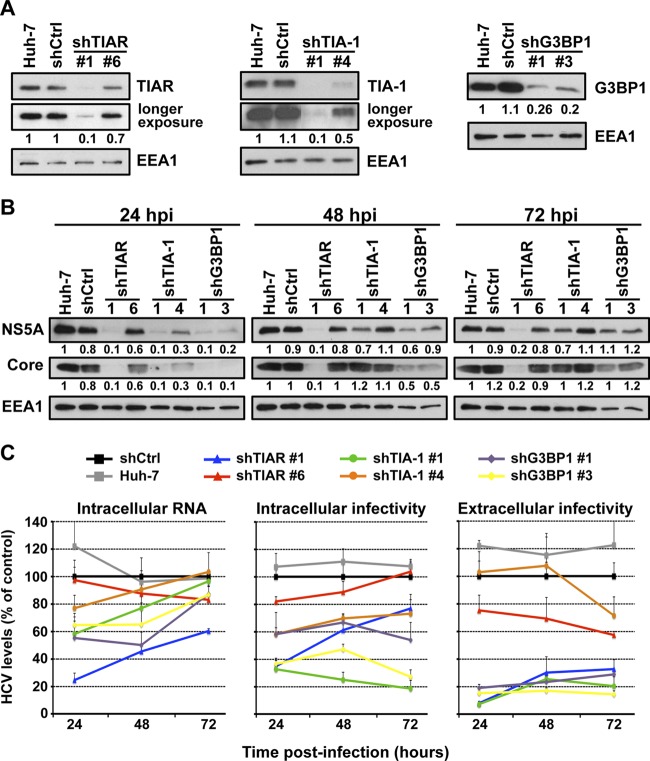
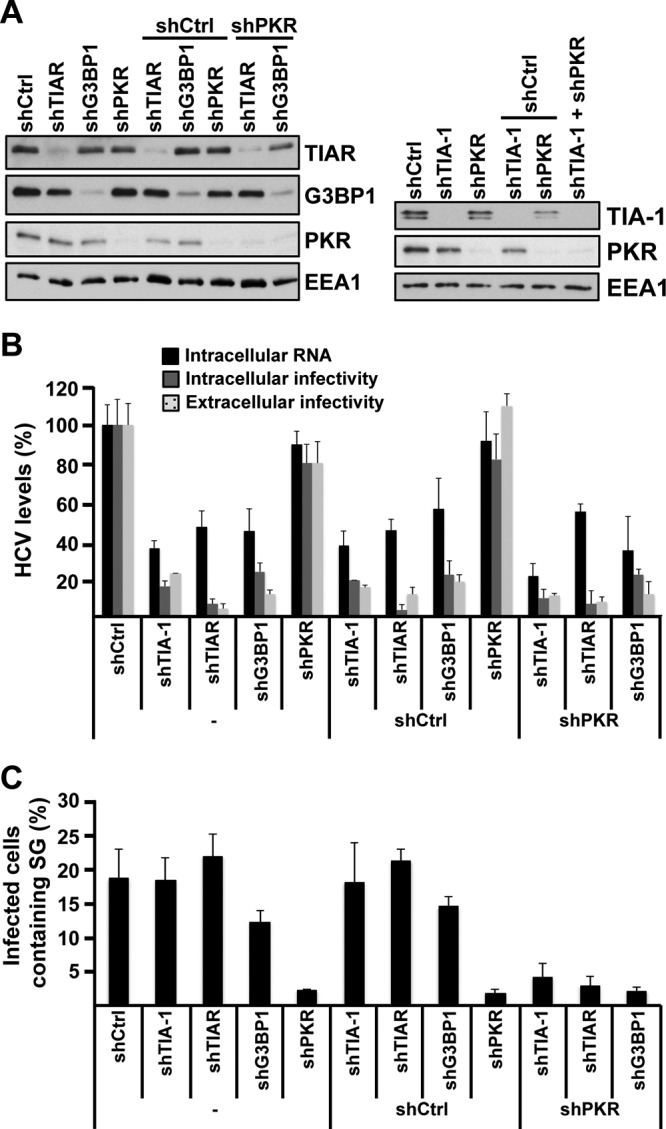
Stress granules (SGs) are cytoplasmic structures that are induced in response to environmental stress, including viral infections. Here we report that hepatitis C virus (HCV) triggers the appearance of SGs in a PKR- and interferon (IFN)-dependent manner. Moreover, we show an inverse correlation between the presence of stress granules and the induction of IFN-stimulated proteins, i.e., MxA and USP18, in HCV-infected cells despite high-level expression of the corresponding MxA and USP18 mRNAs, suggesting that interferon-stimulated gene translation is inhibited in stress granule-containing HCV-infected cells. Finally, in short hairpin RNA (shRNA) knockdown experiments, we found that the stress granule proteins T-cell-restricted intracellular antigen 1 (TIA-1), TIA1-related protein (TIAR), and RasGAP-SH3 domain binding protein 1 (G3BP1) are required for efficient HCV RNA and protein accumulation at early time points in the infection and that G3BP1 and TIA-1 are required for intracellular and extracellular infectious virus production late in the infection, suggesting that they are required for virus assembly. In contrast, TIAR downregulation decreases extracellular infectious virus titers with little effect on intracellular RNA content or infectivity late in the infection, suggesting that it is required for infectious particle release. Collectively, these results illustrate that HCV exploits the stress granule machinery at least two ways: by inducing the formation of SGs by triggering PKR phosphorylation, thereby downregulating the translation of antiviral interferon-stimulated genes, and by co-opting SG proteins for its replication, assembly, and egress.


Figures

Fig 1
Fig 1
HCV triggers stress granule (SG) formation in infected cells. (A) Persistently HCV-infected (at an MOI of 0.1 for 3 weeks) and uninfected control (Mock) Huh-7 cells were seeded in glass bottom 96-well plates, fixed with 4% PFA, and processed for immunofluorescence analysis. In green are stress granule markers (G3BP1, TIA-1, and TIAR); in red, viral E2 or NS5A proteins; and in blue, nuclei stained with Hoechst. Images displayed are examples of 2-μm sections of confocal microscope 40× field snapshots. These results were confirmed in 3 independent experiments. (B) Colocalization of G3BP1 with TIA-1 and TIAR in persistently HCV-infected (at an MOI of 0.1 for 3 weeks) cells. Left panels show staining of TIA-1 (upper panel) and TIAR (lower panel) in green, middle panels show staining of G3BP1 in red, and right panels show the merge of the corresponding images. Yellow dots represent colocalization of G3BP1 with TIA-1 or TIAR protein in SG structures. Images displayed are projections of 5 consecutive 0.4-μm z-series images taken with a confocal microscope. These results were confirmed in 3 independent experiments. (C) Quantitation of SG induction kinetics in HCV-infected Huh-7 cells. Huh-7 cells seeded in a glass bottom 96-well plate format were infected at an MOI of 5 with JFH-1 D183 virus and fixed at the indicated times after infection. After the last time point, all the wells were processed for the detection of cellular G3BP1 and viral E2 proteins by immunofluorescence and pictures were taken in a confocal microscope. Three to five 40× fields were randomly selected, and the presence or absence of SGs was determined in E2-positive cells. The results display the percentage of total cells that are E2 positive (blue bars) and the percentage of E2-positive cells that are also SG positive (red bars). Data are presented as averages and standard deviations (n = 3 to 5). Similar results were obtained in another two independent experiments. (D) Quantitation of sodium arsenite-induced SG formation at different times after HCV infection. Huh-7 cells were infected as described for panel C or left uninfected as a control. At the indicated times after infection, the cells were treated with 0.5 mM sodium arsenite for 45 min and the induction of SGs was quantitated by immunofluorescence as described above. The same treatment of persistently infected cells was done in parallel for comparison. The results are displayed as percentages of cells containing SGs (mean and SD; n = 5). These results are representative of two independent experiments, each one performed in duplicate. (E) Quantitation of SG induction and the intracellular HCV RNA levels in H77S, Jc1, or Jc1 GND RNA-containing cells at the indicated times after electroporation. Huh-7.5.1c2 cells were electroporated as described in Materials and Methods, and the presence of HCV-replicating cells and SGs was determined by staining with antibodies against E2 and G3BP1, respectively. Results are displayed as SG-containing E2-positive cells (left y axis; bars). Asterisks indicate absence of detection. The HCV RNA content at each time point was determined by RT-qPCR and normalized by the GAPDH mRNA levels (right y axis; lines). RNA results are displayed as averages and standard deviations of HCV RNA copy numbers per microgram of total RNA (means and SDs; n = 3). These results are representative of two independent electroporation experiments, each one performed in duplicate.
Fig 2
Fig 2
Stress granule induction in HCV-infected cells is dependent on PKR and is increased by IFN treatment. (A) Huh-7 cells were transduced with lentiviruses expressing shRNAs against PKR (shPKR) or a nontargeting shRNA control (shCtrl). Seven days after transduction, the cells were infected (+) or not (−) with JFH-1 D183 virus at an MOI of 5 and PKR, phospho-eIF2α, HCV core, G3BP1, TIAR, and TIA-1 protein expression was determined 72 h later. EEA1 expression is shown as a loading control. (B) Huh-7 cells that were transduced and infected as described for panel A were fixed with 4% PFA for 30 min at the indicated times after infection. After the last time point, all the wells were processed for the detection of cellular G3BP1 and viral E2 proteins by immunofluorescence, and pictures were taken in a confocal microscope. Three to five 40× fields were randomly selected, and the cells present in those fields (n > 200) were scored for the presence or absence of stress granules. Results are displayed as the percentage of infected cells containing SG. Data are displayed as averages and standard deviations (mean and SD; n = 3 to 5). Arrows point to the reduced SG formation in cells in which PKR had been downregulated. The results displayed are representative of three independent experiments. (C) Interferon enhances SG induction in HCV-infected cells. Huh-7 cells transduced as for panel A were infected with JFH-1 D183 virus at an MOI of 5 and 72 h later were treated with 1,000 U/ml of interferon β (IFN). Seven hours after IFN treatment, the cells were fixed and processed for immunofluorescence for the detection of G3BP1 and viral NS5A proteins. In green is G3BP1, in red NS5A, and in blue the nuclei stained with Hoechst. Images displayed are representative examples of 2-μm-thick sections of confocal microscope 40× field snapshots. (D) Three to five fields were randomly selected, and the E2-positive cells present in those fields (n > 200) were scored for the presence or absence of stress granules (based on G3BP1 staining). Results shown in the graph are displayed as percentages of infected cells containing SGs. Data are displayed as averages and standard deviations (mean and SD; n = 3 to 5). Arrows indicate the reduced SG formation in cells in which PKR had been downregulated. These results were confirmed in three independent experiments. (E) Western blotting of G3BP1, TIA-1, and TIAR expression in Huh-7 cells that were infected or not and treated or not with IFN as for panel C. HCV core and NS5A and cellular EEA1 protein expression is shown as an infection marker and a loading control, respectively.
Fig 3
Fig 3
ISG mRNA and protein induction by IFN in HCV-infected cells. Huh-7 cells were infected (HCV-infected) or not (Mock) with JFH-1 D183 virus at a high multiplicity of infection (MOI = 5). Forty-eight hours later, cells were treated or not with 1,000 U/ml of IFN-β for 7 h. Shown are results of MxA and USP18 mRNA (A) and protein (B) analysis by RT-qPCR and Western blotting, respectively. RNA results were normalized to GAPDH mRNA and are displayed as copy numbers per microgram of total RNA. Data are displayed as the average and standard deviation (mean and SD; n = 3). Core and EEA1 protein expression is shown as an infection marker and a loading control, respectively. These results are representative of 3 independent experiments.
Fig 4
Fig 4
Interferon-stimulated protein expression is suppressed in stress granule-positive HCV-infected cells. Huh-7 cells were infected (HCV-infected) or not (Mock) with JFH-1 D183 virus at a high multiplicity of infection (MOI = 5). Forty-eight hours later, the cells were treated or not with 1,000 U/ml of IFN-β for 7 h. (A) Visualization of MxA (upper panels), USP18 (middle panels), and GAPDH (lower panels) mRNAs (white dots) and the corresponding proteins (in red) as well as G3BP1 protein (in green) by fluorescence in situ hybridization (FISH) and conventional immunofluorescence after IFN treatment of HCV-infected and uninfected control (Mock) cells. Images displayed are of single 0.3-μm z-sections taken in a confocal microscope at a magnification of ×40. Nuclei are displayed in blue. Pictures on the very right are enlargements of the boxed areas showing a partial localization of MxA or USP18 mRNAs in stress granules. (B) Single-cell quantitation analysis of the number of MxA (left graph), USP18 (middle graph), and GAPDH (right graph) mRNA dots and the corresponding protein intensity per cell in samples that were treated with IFN as described above. Three data sets are displayed in each graph: in red, uninfected cells; in green, stress granule-negative HCV-infected cells; and in blue, stress granule-positive HCV-infected cells. Each data point in the graphs represents a single cell. Pearson correlation coefficients (r), their P values, and the number of cells analyzed (n) are displayed for each data set. The results displayed are representative of 2 (USP18 and GAPDH) or 3 (MxA) independent experiments.
Fig 5
Fig 5
Stress granule proteins TIA-1, TIAR, and G3BP1 are required for efficient HCV infection. Huh-7 cells were transduced with lentiviruses that express shRNAs targeting TIA-1, TIAR, or G3BP1 or a nontargeting shRNA control (shCtrl). (A) After 7 days, the downregulation of each protein was confirmed by Western blotting and the relative quantitation was determined by densitometry (shown below each gel). The intensity of TIA-1, TIAR, and G3BP1 proteins relative to EEA1 protein (loading control) in Huh-7 cells was set as 1 and used to calculate the relative amount of each protein. (B) Downregulated and control cells were seeded in 96-well plates at 5,000 cells per well. Four days later, cytotoxicity assays (MTT) were performed by following the manufacturer's instructions. Results are displayed as percentages of the control (shCtrl). Assays were run with 6 replicate wells per cell type in two independent experiments. (C) Downregulated cells were infected with JFH-1 D183 virus at a low multiplicity of infection (MOI = 0.2), and the intracellular HCV RNA levels and extracellular infectivity were determined on day 6 postinfection by RT-qPCR and titration assays, respectively. GAPDH mRNA quantitation of the same cellular extracts was used for normalization of the HCV RNA levels. Results are displayed as percentages of the control (Huh-7 cells). Data are displayed as averages and standard deviations (mean and SD; n = 3). These results were confirmed in 2 independent experiments performed in triplicate.
Fig 6
Fig 6
Colocalization and coimmunoprecipitation of stress granule proteins with HCV viral proteins during infection. (A) Huh-7 cells were infected with JFH-1 D183 virus at a high multiplicity of infection (MOI = 5). Seventy-two hours later, the cells were fixed and processed by immunofluorescence for the detection of G3BP1, TIA-1, or TIAR (in orange) and viral NS5A (in red) proteins. Lipid droplets (in green) were stained using LipidTOX from Invitrogen. Images displayed are representative pictures of single 0.35-μm z-sections taken in a confocal microscope at a magnification of ×63. Nuclei are displayed in blue. The staining of each channel and the merge and the colocalization mask channel between stress granule and NS5A proteins are shown. These results were confirmed in at least 2 independent experiments. (B) Huh-7 cells were infected as described for panel A and were subjected to immunoprecipitations using G3BP1-, TIA-1-, and TIAR-specific antibodies and isotype controls 72 h later, as indicated in Materials and Methods. Detection of target proteins as well as viral core, NS4A, NS4B, NS5A, and NS5B proteins was carried out in the immunoprecipitated material (IP) and the unbound material in the supernatant (S). Gels were loaded using 5% of the starting material (Input), 20% of the immunoprecipitated material (IP), and 5% of the unbound supernatant (S). These results were confirmed in 2 independent experiments.
Fig 7
Fig 7
TIA-1, TIAR, and G3BP1 proteins are not required for maintenance of HCV RNA replication, but they are required at a postreplication step in persistently infected cells. (A and B) Huh-7 cells bearing a subgenomic JFH-1 replicon were transduced with lentiviruses expressing shRNAs targeting TIA-1, TIAR, or G3BP1 or a nontargeting shRNA control (shCtrl). Eight days after transduction, the cells were harvested and the expression and relative quantitation of target proteins and HCV NS5A protein were determined by Western blotting (A). Densitometry results are shown under each gel image. β-Actin was used for normalization. (B) The intracellular HCV RNA content of the same samples was determined by RT-qPCR. GAPDH mRNA quantitation was used for normalization. Results are shown as percentages of the control (shCtrl). Data are displayed as averages and standard deviations (mean and SD; n = 3). These results were confirmed in 3 independent experiments performed in triplicate. (C and D) Persistently infected cells were transduced with lentiviruses expressing shRNA that target TIA-1, TIAR, or G3BP1 or an irrelevant shRNA control (shCtrl). Seven days after transduction, the supernatants were collected and the cells were harvested for further analysis. (C) The expression and relative quantitation of target proteins and HCV NS5A protein were determined by Western blotting. Densitometry results are shown under each gel image. EEA1 protein was used as a loading control. (D) The intracellular HCV RNA and infectivity titer as well as the extracellular infectivity titer were determined by RT-qPCR and titration assays, respectively. GAPDH mRNA quantitation of the same samples was used for normalization of the HCV RNA levels. Black bars, intracellular HCV RNA; gray bars, intracellular infectivity; light gray bars with black dots, extracellular infectivity. Results are shown as percentages of the control (shCtrl). Data are displayed as averages and standard deviations (n = 3). These results are representative of 3 independent experiments, each one performed in triplicate.
Fig 8
Fig 8
TIA-1, TIAR, and G3BP1 proteins are required in early and late steps in the HCV life cycle. Huh-7 cells were transduced with lentiviruses that express shRNAs targeting TIA-1, TIAR, or G3BP1 or a nontargeting shRNA control (shCtrl). (A) After 5 days, the downregulation of the corresponding proteins was confirmed by Western blotting. EEA1 protein expression is shown as a loading control and was used to perform relative quantitation of each band by densitometry analysis. Longer-exposure images are shown for TIAR and TIA-1 gels. (B and C) Downregulated cells were infected with JFH-1 D183 virus at a high multiplicity of infection (MOI = 5), and the accumulation of NS5A and core protein (B) and the accumulation of the intracellular HCV RNA and intracellular and extracellular infectivity (C) were determined at the indicated times postinfection by Western blotting, RT-qPCR, and titration assays, respectively. Relative quantitation of NS5A and core proteins is shown below each gel. EEA1 protein expression was used as a loading control. GAPDH mRNA quantitation of the same cellular extracts was used for normalization of the HCV RNA levels. The RNA and infectivity results are displayed as percentages of the control (shCtrl) at each time point. Data are displayed as averages and standard deviations (mean and SD; n = 3). These results are representative of 3 independent experiments performed in triplicate.
Fig 9
Fig 9
The requirement of TIA-1, TIAR, and G3BP1 proteins in HCV infection is independent of their presence in stress granules. (A) Huh-7 cells were transduced with one or two lentiviruses as indicated, and 5 days later, the expression of target proteins was determined by Western blotting. (B) After downregulation was confirmed, the cells were infected with JFH-1 D183 virus at a high multiplicity of infection (MOI = 5), and the intracellular HCV RNA and infectivity titers and extracellular infectivity titers were determined 24 h later as indicated in Materials and Methods. The results shown are averages and standard deviations (mean and SD; n = 3) (C) Cells infected in parallel were fixed 72 h after inoculation, and the number of HCV-infected cells containing stress granules was determined by immunofluorescence and counting as described for Fig. 2B. The results displayed were confirmed in 2 independent experiments, each one performed in triplicate. The shRNA sequences used in these experiments were shTIA-1 no. 1, shTIAR no. 1, shG3BP1 no. 1, shPKR, and shCtrl.

Similar articles

Cited by

References

    1. Alter HJ, Seeff LB. 2000. Recovery, persistence, and sequelae in hepatitis C virus infection: a perspective on long-term outcome. Semin. Liver Dis. 20:17–35 - PubMed
    1. Anderson P, Kedersha N. 2006. RNA granules. J. Cell Biol. 172:803–808 - PMC - PubMed
    1. Anderson P, Kedersha N. 2009. Stress granules. Curr. Biol. 19:R397–R398 - PubMed
    1. Anderson P, Kedersha N. 2002. Stressful initiations. J. Cell Sci. 115:3227–3234 - PubMed
    1. Arimoto K, Fukuda H, Imajoh-Ohmi S, Saito H, Takekawa M. 2008. Formation of stress granules inhibits apoptosis by suppressing stress-responsive MAPK pathways. Nat. Cell Biol. 10:1324–1332 - PubMed

Publication types

MeSH terms

Substances