Case Reports
. 2012 Aug 27;209(9):1567-82.
doi: 10.1084/jem.20111316. Epub 2012 Jul 30.

Heterozygous TBK1 mutations impair TLR3 immunity and underlie herpes simplex encephalitis of childhood

Affiliations
Case Reports

Heterozygous TBK1 mutations impair TLR3 immunity and underlie herpes simplex encephalitis of childhood

Melina Herman et al. J Exp Med. .

Abstract

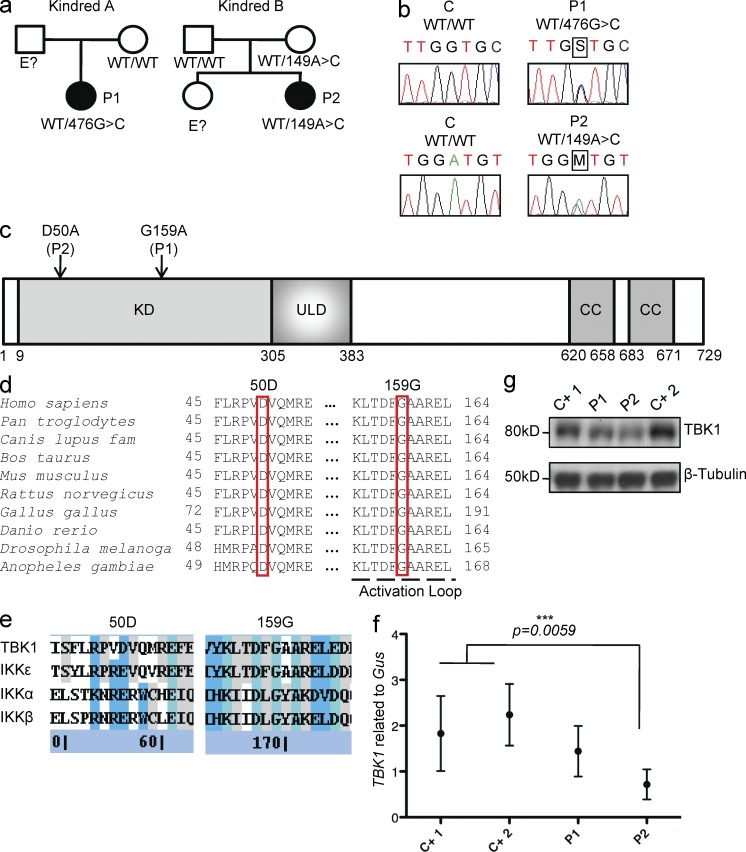
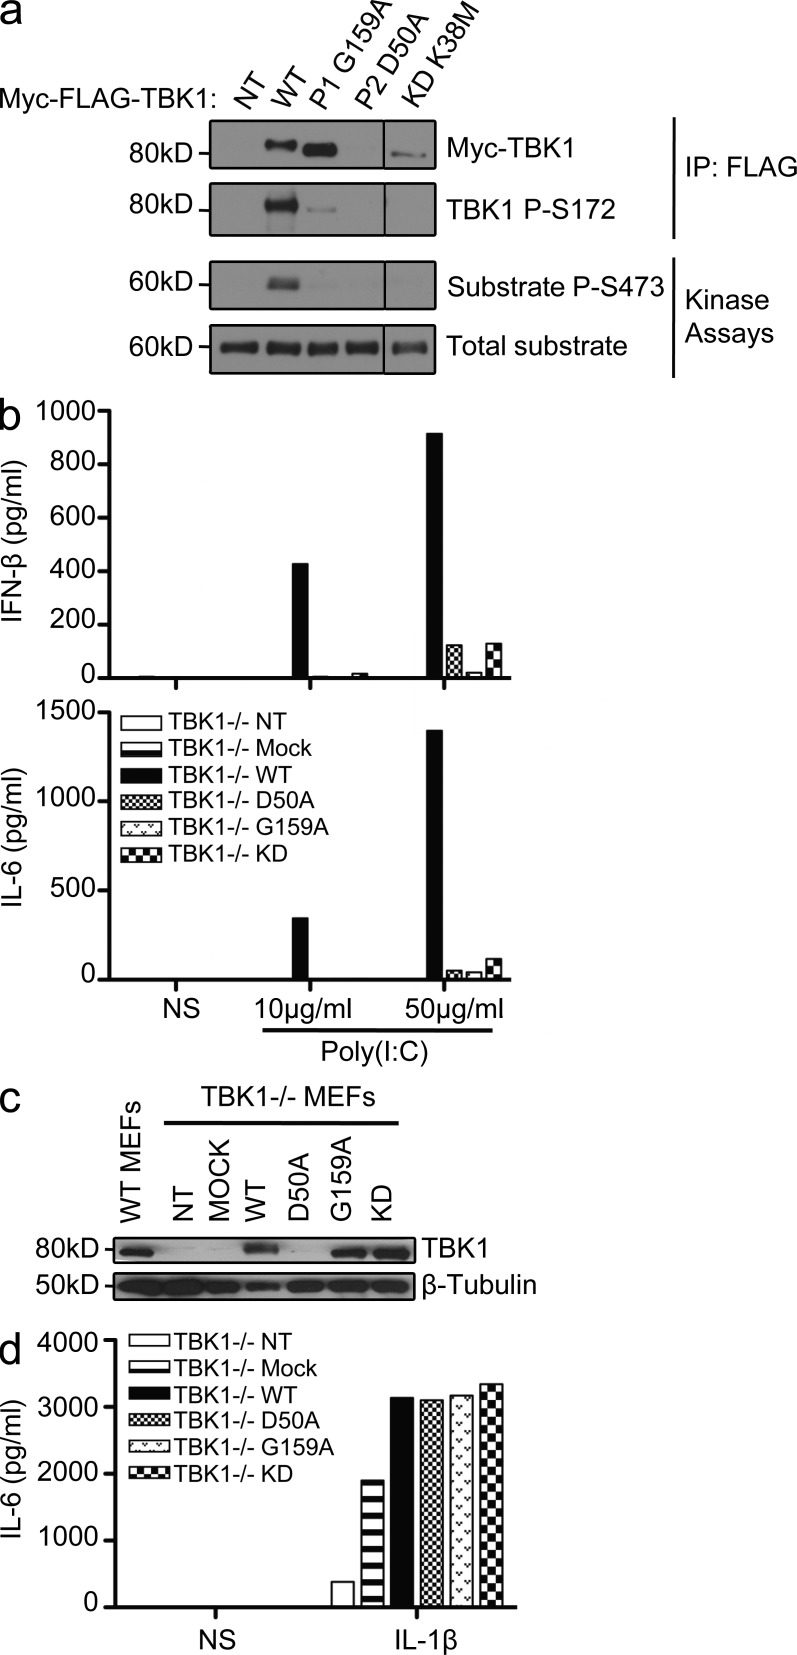
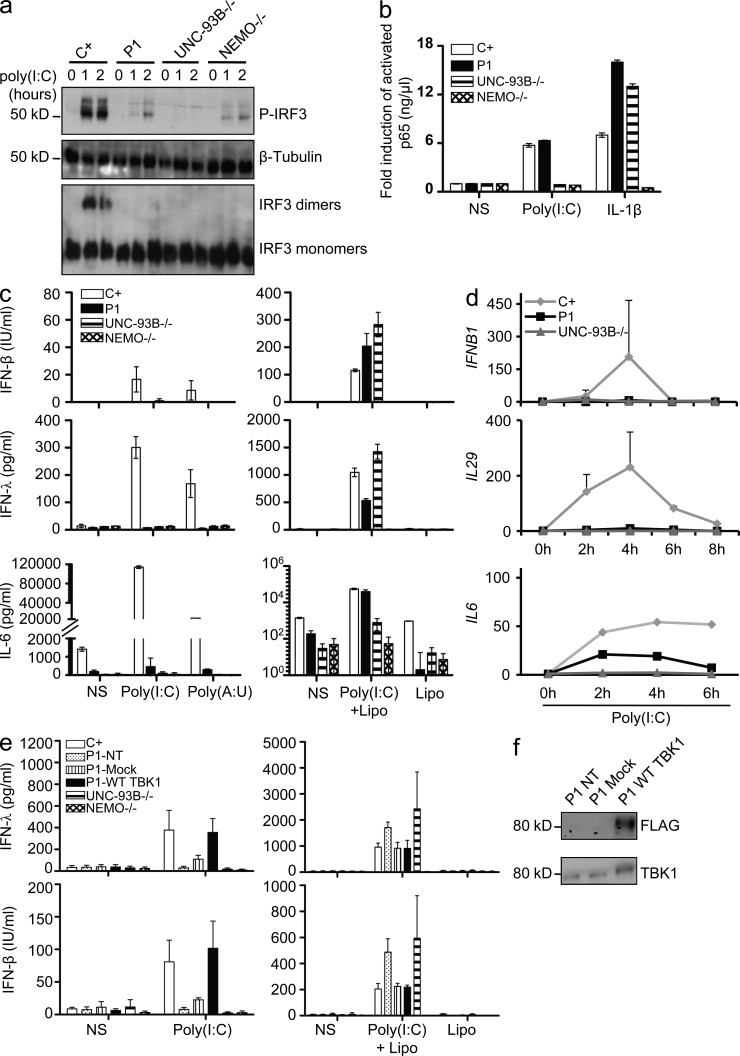
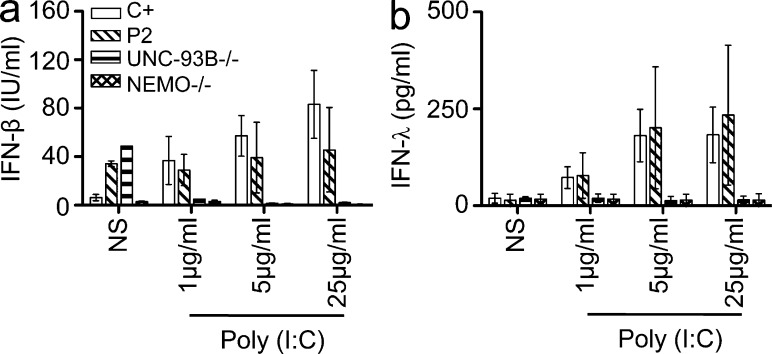
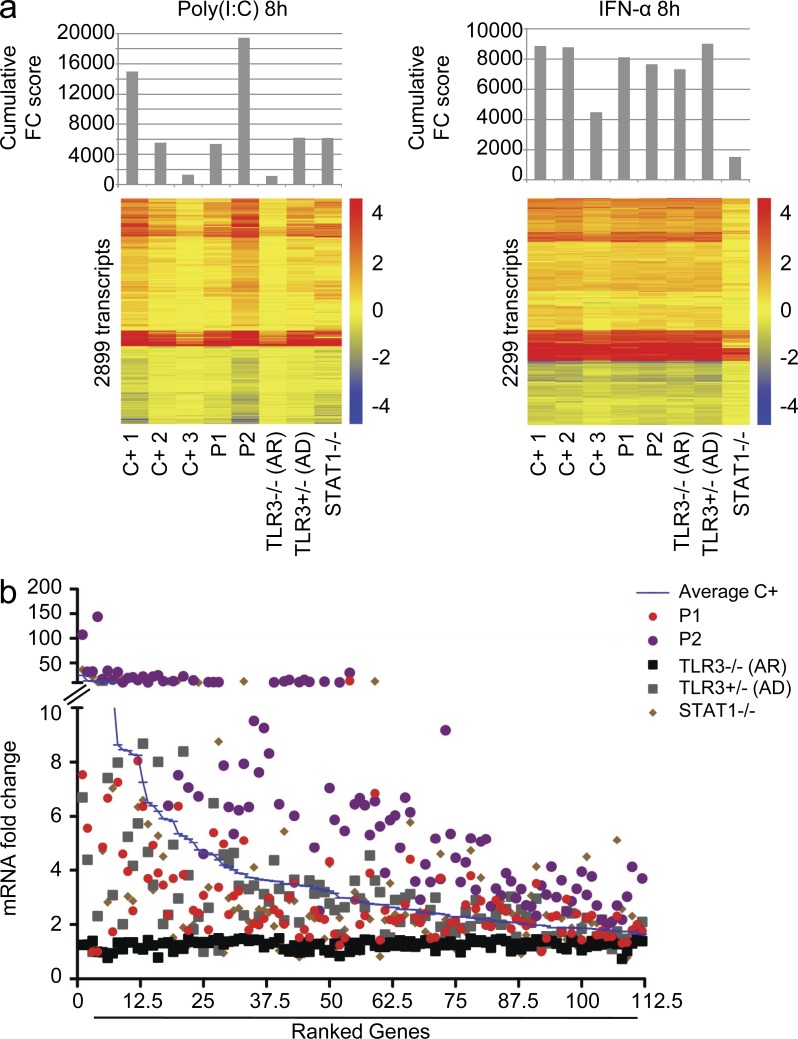
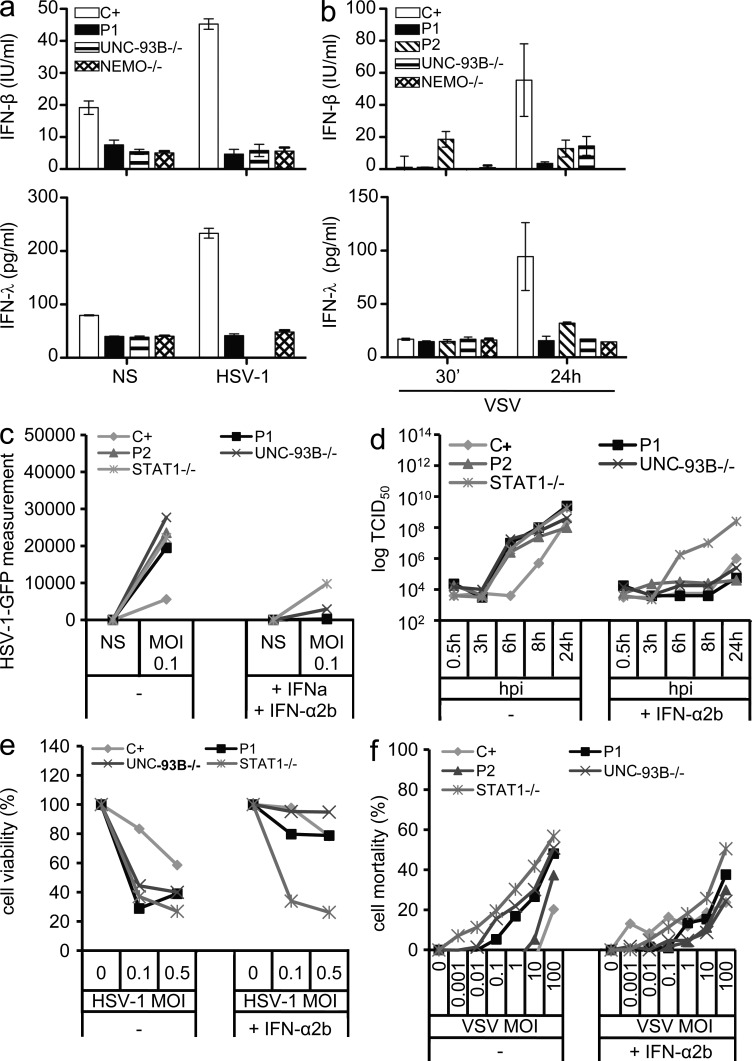
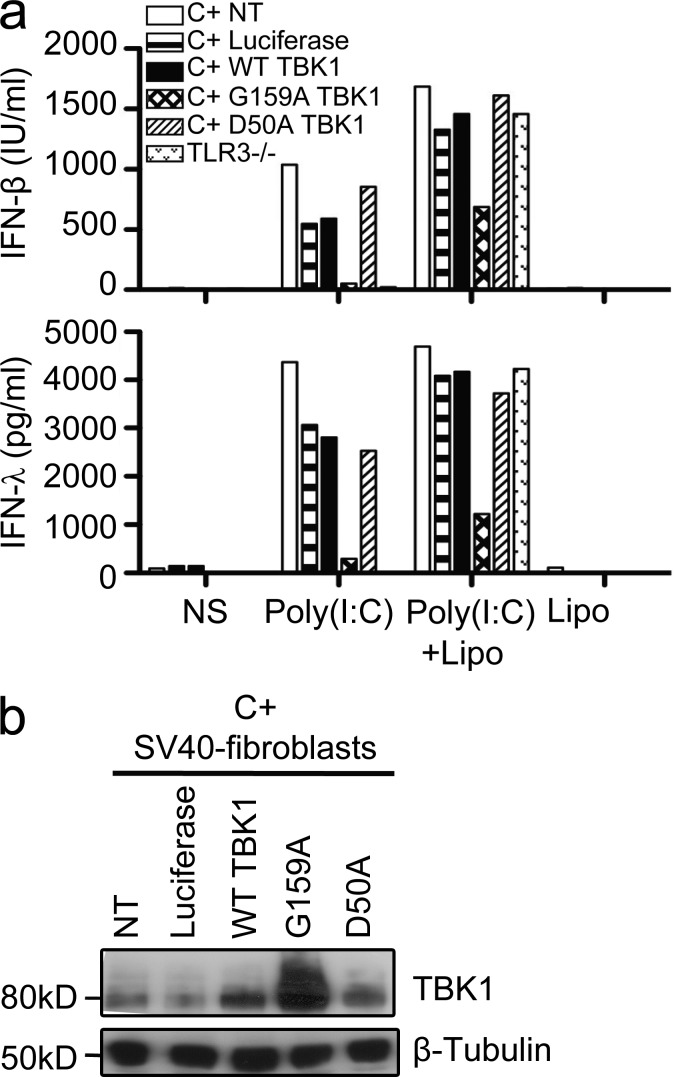
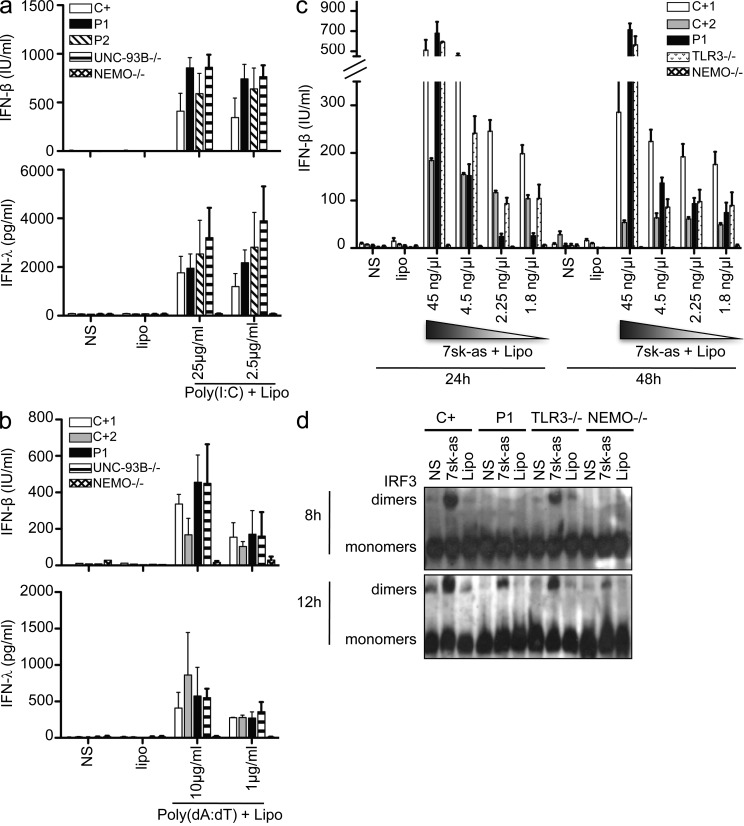
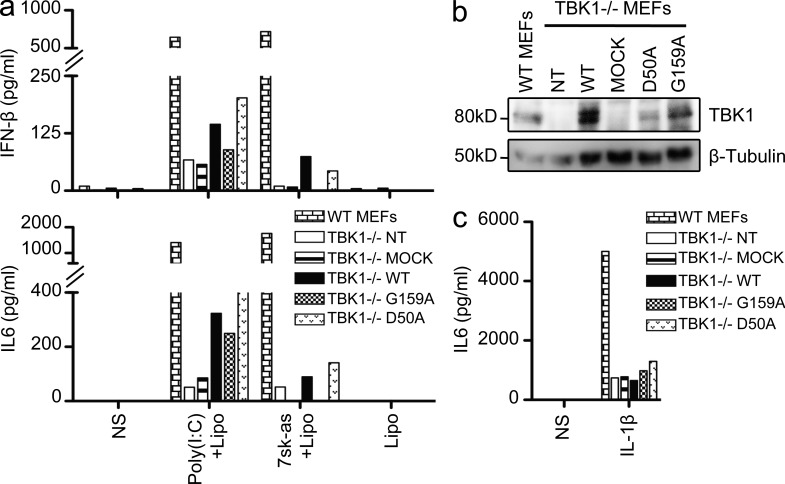
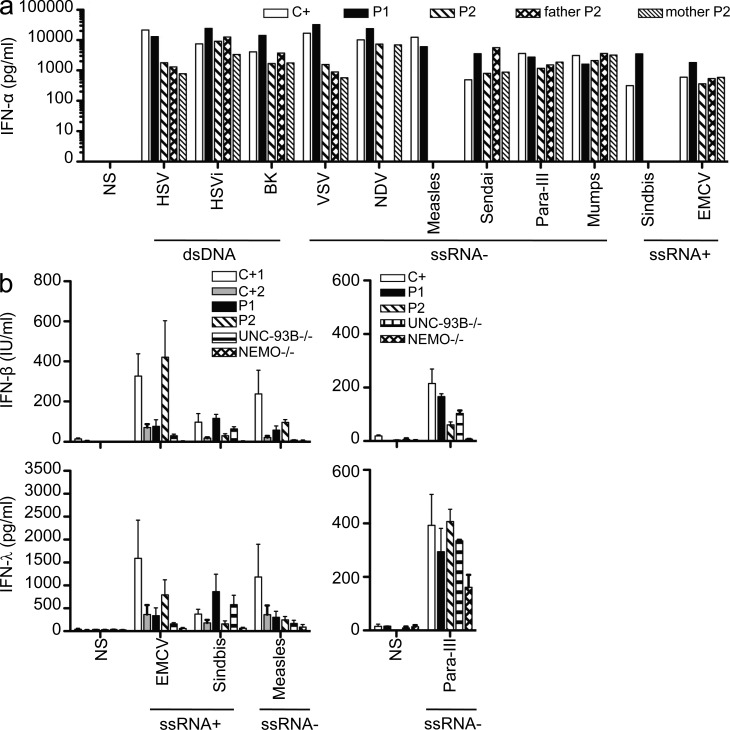
Childhood herpes simplex virus-1 (HSV-1) encephalitis (HSE) may result from single-gene inborn errors of TLR3 immunity. TLR3-dependent induction of IFN-α/β or IFN-λ is crucial for protective immunity against primary HSV-1 infection in the central nervous system (CNS). We describe here two unrelated children with HSE carrying different heterozygous mutations (D50A and G159A) in TBK1, the gene encoding TANK-binding kinase 1, a kinase at the crossroads of multiple IFN-inducing signaling pathways. Both mutant TBK1 alleles are loss-of-function but through different mechanisms: protein instability (D50A) or a loss of kinase activity (G159A). Both are also associated with an autosomal-dominant (AD) trait but by different mechanisms: haplotype insufficiency (D50A) or negative dominance (G159A). A defect in polyinosinic-polycytidylic acid-induced TLR3 responses can be detected in fibroblasts heterozygous for G159A but not for D50A TBK1. Nevertheless, viral replication and cell death rates caused by two TLR3-dependent viruses (HSV-1 and vesicular stomatitis virus) were high in fibroblasts from both patients, and particularly so in G159A TBK1 fibroblasts. These phenotypes were rescued equally well by IFN-α2b. Moreover, the IFN responses to the TLR3-independent agonists and viruses tested were maintained in both patients' peripheral blood mononuclear cells and fibroblasts. The narrow, partial cellular phenotype thus accounts for the clinical phenotype of these patients being limited to HSE. These data identify AD partial TBK1 deficiency as a new genetic etiology of childhood HSE, indicating that TBK1 is essential for the TLR3- and IFN-dependent control of HSV-1 in the CNS.


Figures

Figure 1.
Figure 1.
Heterozygous TBK1 mutations in two children with HSE. (a) Family pedigrees and segregation. (b) Heterozygous TBK1 mutations 476G>C in P1 and 149A>C in P2. The PCR products sequenced were amplified from genomic DNA from the granulocytes of a control (C) and both patients. (c) Schematic diagram of the protein structure of TBK1, featuring its kinase domain (KD), ubiquitin-like domain (ULD), and coiled-coil (CC) regions. Both heterozygous substitutions, 159G>G/A (P1) and 50D>D/A (P2), affect the kinase domain of TBK1 (amino acids 9–305). (d) Multiple alignments of relevant amino acid sequences of the kinase domain of human TBK1 with its homologues from nine other species, with the residues mutated in P1 (G159) and P2 (D50) highlighted. (e) Multiple alignments of relevant amino acid sequences of the kinase domain of human TBK1 with the other IKK and IKK-related kinases, IKK-α (46% similar to TBK1), IKK-β (44% similar), and IKK-ε (64% similar). The residues mutated in P1 and P2 are conserved (G159) or similar (D50) across IKK or IKK-related kinases. (Blue signifies sequence similarity, teal signifies sequence identity, and gray signifies partial identity/similarity.) (f) TBK1 expression, as assessed by RT-qPCR on mRNA from the SV40-fibroblasts of patients (P1 and P2) and control lines (C+1 and C+2). Values represent mean values ± SD calculated from three independent experiments. (g) TBK1 levels, as assessed by Western blotting, in SV40-fibroblasts from patients (P1 and P2) and two control lines (C+ 1 and C+ 2). This Western blot result is representative of three experiments.
Figure 2.
Figure 2.
Both mutant TBK1 alleles are loss-of-function but through different mechanisms. (a) In vitro kinase assays: substrate (Akt) phosphorylation by both mutant kinases, G159A and D50A, compared with the phosphorylation levels for WT TBK1 and the kinase-dead (KD) K38M TBK1. A single experiment representative of three independent experiments performed is shown. HEK293T cells were transfected with WT and mutant constructs or left untransfected (NT). Black lines indicate that intervening lanes have been spliced out. IP, immunoprecipitation. (b) TBK1−/− MEFs were either left untransfected (NT) or were transfected with a mock vector, WT TBK1, or mutant constructs: D50A (mutation present in P2), G159A (the mutation in P1), and S172A (kinase-dead, KD). After 24 h, the cells were stimulated with 10 or 50 µg/ml poly(I:C). ELISA was performed to assess IFN-β and IL-6 production 24 h after stimulation. The data shown are representative of three independent experiments. (c) TBK1 expression from the transfected constructs was assessed by Western blotting with antibodies against TBK1, with β-tubulin used as a loading control. (d) TBK1−/− MEFs were either not transfected (NT) or transfected with a mock vector or a vector encoding WT TBK1 or the mutants, G159A, D50A, or S172A. 24 h later, cells were stimulated with 10 ng/ml IL-1β. IL-6 production was measured by ELISA. The data shown are representative of three independent experiments. NS, nonstimulated.
Figure 3.
Figure 3.
The G159A TBK1 allele of P1 abolishes TLR3-mediated IFN induction in the patient’s fibroblasts. (a) IRF-3 phosphorylation in fibroblasts from P1, as assessed by Western blotting after stimulation with 25 µg/ml poly(I:C) for 0, 1, or 2 h, with β-tubulin as a loading control. Comparison with control cells (C+) and UNC-93B−/− and NEMO−/− fibroblasts. IRF3 dimerization was assessed by native Western blotting. Blots are representative of three independent experiments. Two different healthy control cell lines were tested and gave the same result. (b) Activated p65 levels, as determined by EMSA-ELISA after 30 min of stimulation with IL-1β or 1 h of poly(I:C) in control cells (C+; averaged from two control cell lines), in fibroblasts from P1 and from UNC-93B−/− and NEMO−/− patients. (c) IFN-β, IFN-λ, and IL-6 production, as assessed by ELISA, after 24 h of stimulation with poly(I:C) or poly(A:U) (polyadenylic-polyuridylic acid) or transfection of poly(I:C) mediated by Lipofectamine (Lipo) in control (C+) cells (averaged from two distinct control cell lines) and in fibroblasts from P1 and from UNC-93B−/− and NEMO−/− patients. (d) Induction of mRNA for IFNB1, IL29, and IL6 after stimulation with 25 µg/ml poly(I:C), as assessed by RT-qPCR in fibroblasts from P1, an UNC-93B−/− patient, and controls (C+; averaged from two distinct control cell lines). Graphs present the mean values ± SD of three independent experiments for IFNB1 and IL29. The graph presented for IL6 is representative of two independent experiments. (e) Fibroblasts from P1 were untransfected (NT), mock-transfected, or transfected with a vector encoding FLAG-tagged WT TBK1 and stimulated for 24 h with the indicated reagents (poly(I:C) or poly(I:C) transfection mediated by Lipofectamine). IFN-β and IFN-λ production was assessed by ELISA. (b, c, and e) Values represent mean values ± SD calculated from three independent experiments. (f) Western blot of transfected P1 cells with anti-TBK1 and anti-FLAG antibodies. NS, nonstimulated.
Figure 4.
Figure 4.
TLR3-mediated IFN production is normal in P2’s fibroblasts. (a and b) WT (C+), P2, UNC-93B−/−, and NEMO−/− fibroblasts were stimulated with various doses of poly(I:C) for 24 h. The production of IFN-β (a) and IFN-λ (b) was assessed by ELISA. The graphs show the mean values ± SD for three independent experiments. NS, nonstimulated.
Figure 5.
Figure 5.
Genome-wide transcriptional evaluation of the TLR3 pathway in primary fibroblasts. (a) Cumulative fold change (FC) score (top) and heat maps (bottom) of the transcripts regulated by 8 h of stimulation with poly(I:C) (left) or IFN-α2b (right) in primary fibroblasts from three healthy controls (C+), both TBK1 patients (P1 and P2), a patient with TLR3 AR deficiency (TLR3−/−), a patient with AD TLR3 deficiency (AD TLR3), and a patient with STAT-1 complete deficiency (STAT1−/−). The cumulative score is the sum of all the fold change values of >1.5 (up- or down-regulation). Heat maps show a hierarchical clustering of transcripts differentially expressed upon stimulation (based on 100 differences in intensity and 1.5-fold changes compared with nonstimulated condition in healthy controls). Changes with respect to the unstimulated condition are shown by a color scale: red, up-regulated; blue, down-regulated; yellow, no change. The probes displaying differences of >100 in intensity were used to calculate the cumulative score. (b) Ranking of the 112 transcripts up-regulated after 8 h of poly(I:C) stimulation, with a fold change of at least 1.5 in all three controls tested, in primary fibroblasts from three healthy controls averaged together (Average C+), both TBK1 patients (P1 and P2), a patient with TLR3 AR deficiency (TLR3−/−), a patient with AD TLR3 deficiency (AD TLR3), and a patient with STAT-1 complete deficiency (STAT1−/−).
Figure 6.
Figure 6.
Impaired IFN-dependent control of HSV-1 and VSV infection in the patients’ fibroblasts. (a and b) IFN-β and IFN-λ production, as measured by ELISA, in the patients’ fibroblasts, control cells (C+; averaged from two distinct control cell lines), and UNC-93B−/− and NEMO−/− fibroblasts after 24 h of stimulation with HSV-1 (a) and 30 min or 24 h of stimulation with VSV (b). The graphs display means ± SD determined from three independent experiments. (c and d) Replication of the HSV-1–GFP virus at an MOI of 1 (c) and of VSV at an MOI of 10 (d) in the patients’ fibroblasts (P1 and P2) and in control cells (C+; averaged from two distinct control cell lines), and UNC-93B−/− and STAT-1−/− fibroblasts, as determined at the indicated hours after infection, with or without 18-h IFN-α2b pretreatment. One experiment representative of two independent experiments performed is shown. (e) Viability of control cells (C+; averaged from two different control cell lines) and in fibroblasts from P1, an UNC-93B−/− patient, and a STAT-1−/− patient after infection with HSV-1–GFP at MOIs of 0.1 and 0.5, with or without IFN-α2b treatment 18 h before infection. (f) Cell mortality after 24 h of VSV infection in control cells (C+; averaged from two distinct control cell lines) and in fibroblasts from P1, P2, a UNC-93B−/− patient, and a STAT-1−/− patient, with or without 18-h IFN-α2b pretreatment. NS, nonstimulated.
Figure 7.
Figure 7.
The G159A allele exerts a dominant-negative effect, whereas the D50A allele does not. (a) IFN-β and IFN-λ production, as assessed by ELISA, in response to 50 µg/ml poly(I:C) stimulation or 25 µg/ml poly(I:C) transfection mediated by Lipofectamine (Lipo) in TLR3-deficient fibroblasts and in control fibroblasts (C+) transduced with lentivirus pseudoparticles encoding luciferase, WT TBK1, or one of the TBK1 mutants (G159A or D50A) or left untransduced (NT). Cells were transduced 6 d before stimulation. This experiment is representative of three independent experiments. NS, nonstimulated. (b) Western blot of transduced control fibroblasts (C+) with anti-TBK1 and antitubulin antibodies.
Figure 8.
Figure 8.
Normal responses to dsRNA, dsDNA, and ssRNA introduced by transfection in the patients’ fibroblasts. (a) Production of IFN-β and IFN-λ in response to various doses of poly(I:C), introduced by transfection into control (C+; averaged from two different control cell lines), P1, P2, and UNC-93B– and NEMO-deficient fibroblasts. Values represent mean values ± SD calculated from three independent experiments. (b) Production of IFN-β and IFN-λ in response to various doses of poly(dA:dT) introduced by transfection into control (C+), P1, P2, UNC-93B−/−, and NEMO−/− fibroblasts. Values from three different experiments were averaged and are presented here as mean values ± SD. (c) IFN-β production 24 or 48 h after transfection with the ssRNA 7sk-as in control (C+1 and C+2), P1, TLR3−/−, and NEMO−/− fibroblasts. Values represent mean values ± SD from three independent experiments. (d) IRF3 dimerization, assessed by native Western blotting upon stimulation with 2.25 ng/µl 7sk-as in fibroblasts from P1, at 8 and 12 h; comparison with control WT cells (C+), TLR3−/−, and NEMO−/− fibroblasts. The blots shown are representative of three independent experiments. NS, nonstimulated.
Figure 9.
Figure 9.
Assessing the functionality of both mutant TBK1 alleles in the response to transfected poly(I:C) and ssRNA (7sk-as). (a) TBK1−/− MEFs were either left untransfected (NT) or were transfected with a mock vector, WT TBK1, or mutant constructs: D50A (mutation present in P2) or G159A (the mutation in P1). After 24 h, the cells were stimulated by transfection with Lipofectamine of 25 µg/ml poly(I:C) or 22.5 ng/µl ssRNA (7sk-as). ELISA was performed to assess IFN-β and IL-6 production 24 h after stimulation. The experiment shown is representative of three independent experiments. (b) TBK1 expression from the transfected constructs was assessed by Western blotting with an antibody against TBK1. β-Tubulin was used as a loading control. (c) IL-6 production as assessed by ELISA after stimulation with 10 ng/ml IL-1β for 24 h after transfection in TBK1−/− MEFs either not transfected (NT) or transfected with a mock vector or a vector encoding WT TBK1 or the mutants G159A and D50A TBK1. The experiment shown is representative of three independent experiments. NS, nonstimulated.
Figure 10.
Figure 10.
Both patients present normal responses to other viruses in PBMCs and fibroblasts. (a) PBMCs from a control (C+), P1, P2, and P2’s parents were challenged with several viruses with different types of genomes: dsDNA viruses (HSV-1, UV-inactivated HSV-1 or HSV-1i, and BK), negative-strand ssRNA viruses (VSV, NDV, measles, Sendai virus, human parainfluenza virus III [Para-III], and mumps), and positive-strand ssRNA viruses (Sindbis virus and EMCV). Levels of IFN-α were assessed by ELISA 24 h after infection. P2 and her parents’ cells were not tested for their response to infection with Sindbis and measles. This experiment was performed once. (b) Production of IFN-β and IFN-λ, as assessed by ELISA, in control (C+), P1, P2, UNC-93B−/−, and NEMO−/− fibroblasts 24 h after infection with positive-strand ssRNA viruses (Sindbis virus at an MOI of 10 and EMCV at an MOI of 1) and negative ssRNA viruses (measles at an MOI of 1 and parainfluenza virus III at an MOI of 1). Values represent mean values ± SD from three independent experiments. NS, nonstimulated.

Similar articles

Cited by

References

    1. Abel L., Plancoulaine S., Jouanguy E., Zhang S.Y., Mahfoufi N., Nicolas N., Sancho-Shimizu V., Alcaïs A., Guo Y., Cardon A., et al. 2010. Age-dependent Mendelian predisposition to herpes simplex virus type 1 encephalitis in childhood. J. Pediatr. 157:623–629: 629: e1 10.1016/j.jpeds.2010.04.020 - DOI - PubMed
    1. Adzhubei I.A., Schmidt S., Peshkin L., Ramensky V.E., Gerasimova A., Bork P., Kondrashov A.S., Sunyaev S.R. 2010. A method and server for predicting damaging missense mutations. Nat. Methods. 7:248–249 10.1038/nmeth0410-248 - DOI - PMC - PubMed
    1. Alcaïs A., Quintana-Murci L., Thaler D.S., Schurr E., Abel L., Casanova J.L. 2010. Life-threatening infectious diseases of childhood: single-gene inborn errors of immunity? Ann. N. Y. Acad. Sci. 1214:18–33 10.1111/j.1749-6632.2010.05834.x - DOI - PubMed
    1. Audry M., Ciancanelli M., Yang K., Cobat A., Chang H.H., Sancho-Shimizu V., Lorenzo L., Niehues T., Reichenbach J., Li X.X., et al. 2011. NEMO is a key component of NF-κB- and IRF-3-dependent TLR3-mediated immunity to herpes simplex virus. J. Allergy Clin. Immunol. 128:610–617: e1–e4 10.1016/j.jaci.2011.04.059 - DOI - PMC - PubMed
    1. Bonnard M., Mirtsos C., Suzuki S., Graham K., Huang J., Ng M., Itié A., Wakeham A., Shahinian A., Henzel W.J., et al. 2000. Deficiency of T2K leads to apoptotic liver degeneration and impaired NF-kappaB-dependent gene transcription. EMBO J. 19:4976–4985 10.1093/emboj/19.18.4976 - DOI - PMC - PubMed

Publication types

MeSH terms

Associated data