. 2012 Sep;117(3):548-59.
doi: 10.1097/ALN.0b013e3182661977.

Antimetastatic potential of amide-linked local anesthetics: inhibition of lung adenocarcinoma cell migration and inflammatory Src signaling independent of sodium channel blockade

Affiliations

Antimetastatic potential of amide-linked local anesthetics: inhibition of lung adenocarcinoma cell migration and inflammatory Src signaling independent of sodium channel blockade

Tobias Piegeler et al. Anesthesiology. 2012 Sep.

Abstract

Background: Retrospective analysis of patients undergoing cancer surgery suggests the use of regional anesthesia may reduce cancer recurrence and improve survival. Amide-linked local anesthetics have antiinflammatory properties, although the mechanism of action in this regard is unclear. As inflammatory processes involving Src tyrosine protein kinase and intercellular adhesion molecule-1 are important in tumor growth and metastasis, we hypothesized that amide-linked local anesthetics may inhibit inflammatory Src-signaling involved in migration of adenocarcinoma cells.

Methods: NCI-H838 lung cancer cells were incubated with tumor necrosis factor-α in absence/presence of ropivacaine, lidocaine, or chloroprocaine (1 nM-100 μM). Cell migration and total cell lysate Src-activation and intercellular adhesion molecule-1 phosphorylation were assessed. The role of voltage-gated sodium-channels in the mechanism of local anesthetic effects was also evaluated.

Results: Ropivacaine treatment (100 μM) of H838 cells for 20 min decreased basal Src activity by 62% (P=0.003), and both ropivacaine and lidocaine coadministered with tumor necrosis factor-α statistically significantly decreased Src-activation and intercellular adhesion molecule-1 phosphorylation, whereas chloroprocaine had no such effect. Migration of these cells at 4 h was inhibited by 26% (P=0.005) in presence of 1 μM ropivacaine and 21% by 1 μM lidocaine (P=0.004). These effects of ropivacaine and lidocaine were independent of voltage-gated sodium-channel inhibition.

Conclusions: This study indicates that amide-, but not ester-linked, local anesthetics may provide beneficial antimetastatic effects. The observed inhibition of NCI-H838 cell migration by lidocaine and ropivacaine was associated with the inhibition of tumor necrosis factor-α-induced Src-activation and intercellular adhesion molecule-1 phosphorylation, providing the first evidence of a molecular mechanism that appears to be independent of their known role as sodium-channel blockers.


Figures
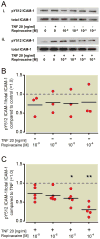
Figure 1
Figure 1. Effect of ropivacaine on the phosphorylation status of Src in NCI-H838 lung cancer cells
(A) (i) Representative Western blot of NCI-H838 cell Src, phosphorylated at tyrosine 419 (pY419 Src, row 1) and total Src (row 2) after treatment with either TNF-α (20 ng/ml) or with different concentrations of ropivacaine (1 nm, 1 μM, 10 μM, 100 μM) for 20 min. (ii) Representative blot of NCI-H838 lung cancer cell pY419 Src (row 1) and total Src (row 2) after treatment with TNF-α (20 ng/ml) with or without different concentrations of ropivacaine (1 nm, 1 μM, 10 μM, 100 μM) for 20 minutes. (B) Relative density of the Western blot bands of pY419 Src normalized to the densitometry values of total Src compared to control (=1.0, dashed line) in the absence of TNF-α expressed. Data from three independent experiments shown as scatter plot (n = 3). Horizontal line indicates mean for each group; * p < 0.05 vs. control. (C) Relative density of the Western blot bands of pY419 Src normalized to the densitometry values of total Src after coincubation of ropivacaine with TNF-α (20 ng/ml) compared to TNF-α alone (=1.0, dashed line). Data from 3 independent experiments shown as scatter plot (n=3). Horizontal line indicates mean for each group; * p < 0.05 vs. TNF-α, ** p < 0.01 vs. TNF-α. TNF-α = Tumor necrosis factor-α.
Figure 2
Figure 2. Effect of ropivacaine on the phosphorylation status of ICAM-1 in NCI-H838 lung cancer cells
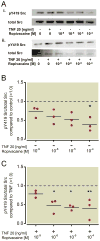
(A) (i) Representative Western blot of NCI-H838 lung cancer cell ICAM-1, phosphorylated at tyrosine 512 (pY512 ICAM-1, row 1) and total ICAM-1 (row 2) after treatment with either TNF-α (20 ng/ml) or different concentrations of ropivacaine (1 nm, 1 μM, 10 μM, 100 μM) for 20 min. (ii) Representative blot of NCI-H838 cell pY512 ICAM-1 (row 1) and total ICAM-1 (row 2) after treatment with TNF-α (20 ng/ml) in the presence or absence of different concentrations of ropivacaine (1 nm, 1 μM, 10 μM, 100 μM) for 20 min. (B) Relative density of the Western blot bands of pY512 ICAM-1 normalized to the densitometry values of total ICAM-1 compared to control (=1.0, dashed line) in the absence of TNF-α. Data from 3 independent experiments shown as scatter plot (n = 3). Horizontal line indicates mean for each group. (C) Relative density of the Western blot bands of pY512 ICAM-1 normalized to the densitometry values of total ICAM-1 after coincubation of ropivacaine with TNF-α (20 ng/ml) compared to TNF-α alone (=1.0, dashed line). Data from five independent experiments shown as scatter plot (n = 5). Horizontal line indicates mean for each group; * p < 0.05 vs. TNF-α, ** p < 0.01 vs. TNF-α. TNF-α = Tumor necrosis factor-α.
Figure 3
Figure 3. Effect of lidocaine on the phosphorylation status of Src in NCI-H838 lung cancer cells
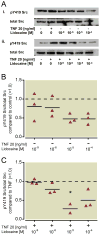
(A) (i) Representative Western blot of NCI-H838 cell Src, phosphorylated at tyrosine 419 (pY419 Src, row 1) and total Src (row 2) after treatment with either TNF-α (20 ng/ml) or with different concentrations of lidocaine (1 nm, 1 μM, 10 μM, 100 μM) for 20 min. (ii) Representative blot of NCI-H838 lung cancer cell pY419 Src (row 1) and total Src (row 2) after treatment with TNF-α (20 ng/ml) with or without different concentrations of lidocaine (1 nm, 1 μM, 10 μM, 100 μM) for 20 min. (B) Relative density of the Western blot bands of pY419 Src normalized to the densitometry values of total Src compared to control (=1.0, dashed line) in the absence of TNF-α. Data from three independent experiments shown as scatter plot (n = 3). Horizontal line indicates mean for each group. (C) Relative density of the Western blot bands of pY419 Src normalized to the densitometry values of total Src after coincubation of lidocaine with TNF-α (20 ng/ml) compared to TNF-α alone (=1.0, dashed line). Data from three independent experiments shown as scatter plot (n = 3). Horizontal line indicates mean for each group; * p < 0.05 vs. TNF-α. TNF-α = Tumor necrosis factor-α.
Figure 4
Figure 4. Effect of lidocaine on the phosphorylation status of ICAM-1 in NCI-H838 lung cancer cells
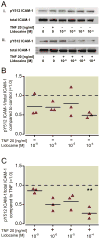
(A) (i) Representative Western blot of NCI-H838 lung cancer cell ICAM-1, phosphorylated at tyrosine 512 (pY512 ICAM-1, row 1) and total ICAM-1 (row 2) after treatment with either TNF-α (20 ng/ml) or different concentrations of lidocaine (1 nm, 1 μM, 10 μM, 100 μM) for 20 min. (ii) Representative blot of NCI-H838 cell pY512 ICAM-1 (row 1) and total ICAM-1 (row 2) after treatment with TNF-α (20 ng/ml) in the presence or absence of different concentrations of lidocaine (1 nm, 1 μM, 10 μM, 100 μM) for 20 min. (B) Relative density of the Western blot bands of pY512 ICAM-1 normalized to the densitometry values of total ICAM-1 compared to control (=1.0, dashed line) in the absence of TNF-α. Data from three independent experiments shown as scatter plot (n = 3). Horizontal line indicates mean for each group. (C) Relative density of the Western blot bands of pY512 ICAM-1 normalized to the densitometry values of total ICAM-1 after coincubation of lidocaine with TNF-α (20 ng/ml) compared to TNF-α alone (=1.0, dashed line). Data from three independent experiments shown as scatter plot (n = 3). Horizontal line indicates mean for each group; ** p < 0.01 vs. TNF-α. TNF-α = Tumor necrosis factor-α.
Figure 5
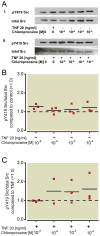
Figure 5. Effect of chloroprocaine on the phosphorylation status of Src in NCI-H838 lung cancer cells
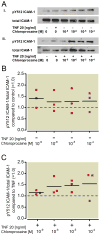
(A) (i) Representative Western blot of NCI-H838 cell Src, phosphorylated at tyrosine 419 (pY419 Src, row 1) and total Src (row 2) after treatment with either TNF-α (20 ng/ml) or with different concentrations of chloroprocaine (1 nm, 1 μM, 10 μM, 100 μM) for 20 min. (ii) Representative blot of NCI-H838 lung cancer cell pY419 Src (row 1) and total Src (row 2) after treatment with TNF-α (20 ng/ml) with or without different concentrations of chloroprocaine (1 nm, 1 μM, 10 μM, 100 μM) for 20 min. (B) Relative density of the Western blot bands of pY419 Src normalized to the densitometry values of total Src compared to control (=1.0, dashed line) in the absence of TNF-α. Data from three independent experiments shown as scatter plot (n = 3). Horizontal line indicates mean for each group. (C) Relative density of the Western blot bands of pY419 Src normalized to the densitometry values of total Src after coincubation of chloroprocaine with TNF-α (20 ng/ml) compared to TNF-α alone (=1.0, dashed line). Data from three independent experiments shown as scatter plot (n = 3). Horizontal line indicates mean for each group. TNF-α = Tumor necrosis factor-α.
Figure 6
Figure 6. Effect of chloroprocaine on the phosphorylation status of ICAM-1 in NCI-H838 lung cancer cells
(A) (i) Representative Western blot of NCI-H838 lung cancer cell ICAM-1, phosphorylated at tyrosine 512 (pY512 ICAM-1, row 1) and total ICAM-1 (row 2) after treatment with either TNF-α (20 ng/ml) or different concentrations of chloroprocaine (1 nm, 1 μM, 10 μM, 100 μM) for 20 min. (ii) Representative blot of NCI-H838 cell pY512 ICAM-1 (row 1) and total ICAM-1 (row 2) after treatment with TNF-α (20 ng/ml) in the presence or absence of different concentrations of chloroprocaine (1 nm, 1 μM, 10 μM, 100 μM) for 20 min. (B) Relative density of the Western blot bands of pY512 ICAM-1 normalized to the densitometry values of total ICAM-1 compared to control (=1.0, dashed line) in the absence of TNF-α. Data from 3 independent experiments shown as scatter plot (n = 3). Horizontal line indicates mean for each group. (C) Relative density of the Western blot bands of pY512 ICAM-1 normalized to the densitometry values of total ICAM-1 after co-incubation of lidocaine with TNF-α (20 ng/ml) compared to TNF-α alone (=1.0, dashed line). Data from 3 independent experiments shown as scatter plot (n = 3). Horizontal line indicates mean for each group. TNF-α = Tumor necrosis factor-α.
Figure 7
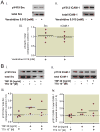
Figure 7. Effect of a sodium channel activator and blocker on the phosphorylation status of Src and ICAM-1 in NCI-H838 lung cancer cells
(A) (i) Representative Western blot of NCI-H838 cell Src, phosphorylated at tyrosine 419 (pY419 Src, row 1) and total Src (row 2) after treatment with Veratridine (0.015 mM) for 45 min. (ii) Representative blot of NCI-H838 lung cancer cell pY512 ICAM-1 (row 1) and total Src (row 2) after treatment with Veratridine (0.015 mM) for 45 min. (iii) Relative density of the Western blot bands of pY419 Src normalized to total Src (squares) and pY512 ICAM-1 normalized to total ICAM-1 (circles) compared to control (=1.0, dashed line) after treatment with Veratridine (0.015 mM) for 45 min. Data from four independent experiments shown as scatter plot (n = 4). Horizontal line indicates mean for each group. (B) (i) Representative Western blot of NCI-H838 cell Src, phosphorylated at tyrosine 419 (pY419 Src, row 1) and total Src (row 2) after pretreatment with tetrodotoxin (TTX, 100 nM) for 10 minutes and subsequent addition of TNF-α (20 ng/ml) for 20 min. (ii) Representative Western blot of NCI-H838 cell ICAM-1, phosphorylated at tyrosine 512 (pY512 ICAM-1, row 1) and total ICAM-1 (row 2) after pretreatment with TTX (100 nM) for 10 min and subsequent addition of TNF-α (20 ng/ml) for 20 min. (iii) Relative density of the Western blot bands of pY419 Src normalized to the densitometry values of total Src compared to control (=1.0, dashed line) after pre-treatment with tetrodotoxin (TTX, 100 nM) for 10 min and subsequent addition of TNF-α (20 ng/ml) for 20 minutes. Data from four independent experiments shown as scatter plot (n = 4). Horizontal line indicates mean for each group. (iv) Relative density of the Western blot bands of pY512 ICAM-1 normalized to the densitometry values of total ICAM-1 after pretreatment with tetrodotoxin (TTX, 100 nM) for 10 min and subsequent addition of TNF-α (20 ng/ml) for 20 min compared to control (=1.0, dashed line). Data from three independent experiments shown as scatter plot (n = 3). Horizontal line indicates mean for each group. TNF-α = Tumor necrosis factor-α.
Figure 8
Figure 8. Migratory ability of NCI-H838 lung cancer cells in the presence of ropivacaine, lidocaine and chloroprocaine
Determination of in vitro transmigration of NCI-H838 cells through a polycarbonate membrane after 4 h in the absence or presence of different concentrations (1 pm, 1 nM, 1 μM, 10 μM, 100 μM) of (A) ropivacaine, (B) lidocaine and (C) chloroprocaine. (D) Determination of in vitro transmigration of NCI-H838 cells through a polycarbonate membrane after 4 h in the absence or presence of different concentrations (1 pm, 1 nM, 1 μM, 10 μM, 100 μM) of ropivacaine for only 15 min followed by a wash of the cells with fresh medium right before the start of the assay. Cells were stained with a fluorescent dye before the start of the assay and lysed after migration through the membrane. Fluorescence was measured at 435/535 nm (excitation/emission). Values for untreated cells have been set as 1.0 (dashed line). Data from 4 (A and B) or 3 (C and D) independent experiments shown as scatter plot. Horizontal line indicates mean for each group; ** p < 0.01 vs. control, RFU = relative fluorescence units.

Similar articles

Cited by

References

    1. Jemal A, Bray F, Center MM, Ferlay J, Ward E, Forman D. Global cancer statistics. CA Cancer J Clin. 2011;61:69–90. - PubMed
    1. Izbicki JR, Passlick B, Pantel K, Pichlmeier U, Hosch SB, Karg O, Thetter O. Effectiveness of radical systematic mediastinal lymphadenectomy in patients with resectable non-small cell lung cancer: Results of a prospective randomized trial. Ann Surg. 1998;227:138–44. - PMC - PubMed
    1. Chen ZL, Perez S, Holmes EC, Wang HJ, Coulson WF, Wen DR, Cochran AJ. Frequency and distribution of occult micrometastases in lymph nodes of patients with non-small-cell lung carcinoma. J Natl Cancer Inst. 1993;85:493–8. - PubMed
    1. Kim AW. Lymph node drainage patterns and micrometastasis in lung cancer. Semin Thorac Cardiovasc Surg. 2009;21:298–308. - PubMed
    1. Senturk M. New concepts of the management of one-lung ventilation. Curr Opin Anesthesiol. 2006;19:1–4. - PubMed

Publication types

MeSH terms