. 2012 Jul 25;32(30):10383-95.
doi: 10.1523/JNEUROSCI.1498-12.2012.

Galectin-3 is required for resident microglia activation and proliferation in response to ischemic injury

Affiliations

Galectin-3 is required for resident microglia activation and proliferation in response to ischemic injury

Mélanie Lalancette-Hébert et al. J Neurosci. .

Abstract

Growing evidence suggests that galectin-3 is involved in fine tuning of the inflammatory responses at the periphery, however, its role in injured brain is far less clear. Our previous work demonstrated upregulation and coexpression of galectin-3 and IGF-1 in a subset of activated/proliferating microglial cells after stroke. Here, we tested the hypothesis that galectin-3 plays a pivotal role in mediating injury-induced microglial activation and proliferation. By using a galectin-3 knock-out mouse (Gal-3KO), we demonstrated that targeted disruption of the galectin-3 gene significantly alters microglia activation and induces ∼4-fold decrease in microglia proliferation. Defective microglia activation/proliferation was further associated with significant increase in the size of ischemic lesion, ∼2-fold increase in the number of apoptotic neurons, and a marked deregulation of the IGF-1 levels. Next, our results revealed that contrary to WT cells, the Gal3-KO microglia failed to proliferate in response to IGF-1. Moreover, the IGF-1-mediated mitogenic microglia response was reduced by N-glycosylation inhibitor tunicamycine while coimmunoprecipitation experiments revealed galectin-3 binding to IGF-receptor 1 (R1), thus suggesting that interaction of galectin-3 with the N-linked glycans of receptors for growth factors is involved in IGF-R1 signaling. While the canonical IGF-1 signaling pathways were not affected, we observed an overexpression of IL-6 and SOCS3, suggesting an overactivation of JAK/STAT3, a shared signaling pathway for IGF-1/IL-6. Together, our findings suggest that galectin-3 is required for resident microglia activation and proliferation in response to ischemic injury.


Figures

Figure 1.
Figure 1.
Galectin-3 expression is silent in normal condition and it is restricted to the stroke area region after MCAO. A, Iba-1, a common microglial marker, is normally expressed in the resting microglia in the whole brain and in baseline condition. B, Resting microglial cells in normal conditions are completely devoid of any galectin-3 immunoreactivity. C, Schematic representation of the brain sections used for immunohistochemistry experiments. Box represents the cortex area magnified in D–G. The dash line represents the stroke area region. DG, Immunohistochemistry of different microglial markers showed an Iba-1 expression in the stroke area region but also in noninfarct area (D, F) contrary to the galectin-3 expression, which is restricted to the stroke area region (E, G). HJ, High-magnification confocal images of the activated microglial cells from the stroked brain show colocalization of Iba-1 staining with galectin-3. Scale bars: A, D, 100 μm; F, 50 μm; H, 20 μm.
Figure 2.
Figure 2.
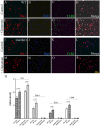
Galectin-3-deficient primary adult microglial cells in culture do not upregulate TLR2 signals in response to excitotoxic injury. A–D, In basal conditions the adult WT microglial cells derived from the cortexes of the 2–3-month-old mice express general Iba1 microglial cells marker (red) and low levels of microglia activation markers including galectin-3 (blue) and TLR2 (green). E–H, Acute 10 min exposure to 100 μm glutamate induced marked increase in Iba-1, glaeticn-3, and TLR2 immunoreactivities in WT microglial cells. Majority of the activated microglial cells in culture coexpressed all three markers (H). I–L, In basal conditions, the Gal-3KO primary microglia cells express similar levels of Iba-1 immunoreactivity as WT cells (red); however, we did not detect any TLR2 immunostaining (green). M–P, While short-term glutamate treatment induced a marked increase in Iba-1 staining, unlike WT microglia, the Gal-3KO microglial cells did not upregulate TLR2. (K, O). Nuclear Dapi staining (blue) confirmed the presence of the viable cells (J, N). Q, Densitometry quantification revealed significant increase in Iba-1 immunoreactivities 24 h after 10 min glutamate (100 μm) treatment in both WT and Gal-3KO primary adult microglial cells. Contrary to WT microglia, the Gal-3KO microglial cells were completely devoid of any TLR2 and CD68 immunoreactivities in basal conditions and after glutamate treatment. Data are expressed as mean ± SEM as average of at least 4 independent experiments. p values are presented in the graph. Scale bar, 50 μm.
Figure 3.
Figure 3.
Real-time visualization of the biophotonic/bioluminescent TLR2 signals obtained from the brains of live WT and Gal-3KO/TLR2-luc/gfp reporter mice. AH, Representative images of the WT male (A–D) and Gal-3KO male 2–3-month-old mice (E–H) imaged before and then 2, 5, and 7 d after MCAO. The images were longitudinally recorded from the same animal and represent the spatial and temporal dynamics of the TLR2 response/microglial activation over a 7 d time period. Scales on the right are color maps of the photon counts. I, Quantification of the luciferase signals obtained by LivingImage 4.1 software (CaliperLS) revealed significantly higher TLR2 signals induction in the brains of the WT reporter mice (n = 8–10, *p = 0.02, **p = 0.007).
Figure 4.
Figure 4.
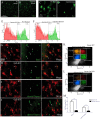
Reduction in microglial cell numbers and proliferation after MCAO in Gal-3KO mice. A, B, Iba-1, a general marker of microglial cell (green), is expressed in normal brain in WT (A) and Gal-3KO (B) mice. E, F, In the basal control conditions, no difference in the number of microglial cells is found between WT and Gal-3KO brain samples as seen by CD11b-APC flow cytometry staining (WT: 33.2 ± 2.2% cells, Gal-3KO: 30.6 ± 3% cells, n = 3, p = 0.82) (E, F). C, D, Seventy-two hours after MCAO, Iba-1-positive microglia change in morphology and appear to be in less numbers Gal-3KO compared with WT mice. G, H, Representative photomicrographs of Iba-1 (in red) and BrdU (in green) staining in WT (G) and Gal-3KO (H) mice show colocalization between both markers in greater amount in WT mice. I, J, Double immunofluorescence staining revealed no colocalization between the microglial marker CD11b and the cleaved caspase-3 staining. K–M, Isolated brain mononuclear cells were analyzed using 2-color flow cytometry. Cells were gated using side and forward scatter to include viable cells and were analyzed for the of CD11b and BrdU expression in WT (K) and Gal-3KO (L) tissues 72 h after MCAO. Flow cytometry analysis shows that there is a significant decrease in the number of CD11b+ cells in Gal-3KO as compared with WT after stroke (CD11b+ cells WT: 14.5 ± 2.1% cells, Gal-3KO: 2.1 ± 0.52% cells, n = 5, ***p < 0.0001). The number of proliferating microglia (CD11b-high/BrdU+ population) in Gal-3KO mice is also significantly reduced as compared with WT (WT: 6.4 ± 1.2% cells, Gal-3KO: 1.6 ± 0.3% cells, n = 5, **p < 0.001). Scale bars: A, 100 μm; C, 50 μm; G, 25 μm.
Figure 5.
Figure 5.
Increase in stroke area and neuronal apoptosis in Gal-3KO mice. A, A 25% increase in the stroke area is observed in Gal-3KO mice compared with WT mice 72 h after MCAO (*p = 0.0166). B, TTC staining was performed to calculate the stroke area region (dotted line). CH, Immunofluorescence of NeuN (neuronal marker, in red) (C, F) and cleaved caspase-3 (apoptosis marker, in green) (D, G) demonstrated a colocalization between both markers (E, H) 72 h after MCAO in WT and Gal-3KO mice. I, Quantification of the number of cleaved caspase-3-positive cells reveals a twofold increase in the number of apoptotic cells in Gal-3KO mice compared with WT (**p = 0.0019). Scale bar, 250 μm.
Figure 6.
Figure 6.
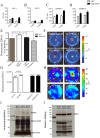
Gal-3KO microglial cells are not responsive to IGF-induced mitogenic signals. A–D, Protein analysis of brain homogenate reveals different expression profile in the level of IGF-1 and the IGF-1 protein member family in WT compared with Gal-3KO mice after stroke. The levels of IGF-1 and IGF-2 (A, B) and IGFBP-2 and -3 (C, D), major IGF-1 binding proteins, were significantly increased in the stroked brains of Gal-3KO mice at 6 and 24 h (*p = 0.05, **p = 0.001). E, G, Primary cells culture experiments show a 10–13% increase in the number of cells after the exogenous addition of IGF-1 (50 μg/ml) in the WT culture. No significant difference was obtained in Gal-3KO culture in the presence of IGF-1. A similar effect was observed with the addition of the N-glycosylation inhibitor tunicamycine (5 μg/ml). Striped bar represents a baseline fluorescence levels obtained from in vivo imaging (F). F, H, Representative images of the cell proliferation quantitative assay using a fluorescent marker, CyQuant NF. The images were obtained with an IVIS 200 Imaging System 24 h after stimulation with IGF-1 and/or tunicamycin in neonatal primary microglial cultures (F) and in adult primary microglial cell cultures derived from the brains (cortex) of 2–3-month-old WT and Gal-3KO mice (H). I, J, Coimmunoprecipitation experiments using mouse monoclonal anti-galectin-3 antibody preincubated with Protein G magnetic beads revealed interaction between IGF-1 receptor and galectin-3.
Figure 7.
Figure 7.
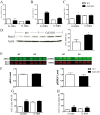
Galectin-3 deficiency is associated with overexpression of IL-6 and induction of SOCS3. Increase in protein levels of proinflammatory cytokines 24 and 72 h after MCAO. A–C, Brain lysates were generated and the presence of key inflammatory cytokines was determined using a cytokine array (RayBiotech). While IL 1-β was downregulated, galectin-3 deficiency was associated with significant increase in the levels of IL-6 24 and 72 h after MCAO and the early increase in TNFα at 24 h. D, Overexpression of IL-6 was accompanied by an increase in the levels of SOCS3. Analysis of the end effectors of the canonical IGF-1 downstream targets revealed no changes in the phosphorylation of the end effectors of the canonical IGF-1 signaling pathways. E, F, There were no significant changes in the levels of phospho-ERK and pGSK3β levels between WT and galectin-3 deficient mice 72 h after stroke. G, H, Analysis of the brain lysates using cytokine arrays further revealed that galectin-3 deficiency was associated with an increase in M-CSF levels 24 h after stroke while GM-CSF levels were increased 24 and 72 h after stroke (*p < 0.01; **p < 0.001; ***p < 0.0001).

Similar articles

Cited by

References

    1. Abroun S, Ishikawa H, Tsuyama N, Liu S, Li FJ, Otsuyama K, Zheng X, Obata M, Kawano MM. Receptor synergy of interleukin-6 (IL-6) and insulin-like growth factor-I in myeloma cells that highly express IL-6 receptor alpha [corrected] Blood. 2004;103:2291–2298. - PubMed
    1. Alexandrova ML, Bochev PG. Oxidative stress during the chronic phase after stroke. Free Radic Biol Med. 2005;39:297–316. - PubMed
    1. Allan SM, Rothwell NJ. Cytokines and acute neurodegeneration. Nat Rev Neurosci. 2001;2:734–744. - PubMed
    1. Allan SM, Tyrrell PJ, Rothwell NJ. Interleukin-1 and neuronal injury. Nat Rev Immunol. 2005;5:629–640. - PubMed
    1. Beaulieu JM, Kriz J, Julien JP. Induction of peripherin expression in subsets of brain neurons after lesion injury or cerebral ischemia. Brain Res. 2002;946:153–161. - PubMed

Publication types

MeSH terms