. 2012 Mar;2(3):e60.
doi: 10.1038/bcj.2012.5. Epub 2012 Mar 9.

Targeting MCL-1 sensitizes FLT3-ITD-positive leukemias to cytotoxic therapies

Targeting MCL-1 sensitizes FLT3-ITD-positive leukemias to cytotoxic therapies

S Kasper et al. Blood Cancer J. 2012 Mar.

Abstract

Patients suffering from acute myeloid leukemias (AML) bearing FMS-like tyrosine kinase-3-internal tandem duplications (FLT3-ITD) have poor outcomes following cytarabine- and anthracyclin-based induction therapy. To a major part this is attributed to drug resistance of FLT3-ITD-positive leukemic cells. Against this background, we have devised an antibody array approach to identify proteins, which are differentially expressed by hematopoietic cells in relation to activated FLT3 signaling. Selective upregulation of antiapoptotic myeloid cell leukemia-1 (MCL-1) was found in FLT3-ITD-positive cell lines and primary mononuclear cells from AML patients as compared with FLT3-wild-type controls. Upregulation of MCL-1 was dependent on FLT3 signaling as confirmed by its reversion upon pharmacological inhibition of FLT3 activity by the kinase inhibitor PKC412 as well as siRNA-mediated suppression of FLT3. Heterologously expressed MCL-1 substituted for FLT3 signaling by conferring resistance of hematopoietic cells to antileukemia drugs such as cytarabine and daunorubicin, and to the proapoptotic BH3 mimetic ABT-737. Conversely, suppression of endogenous MCL-1 by siRNA or by flavopiridol treatment sensitized FLT3-ITD-expressing hematopoietic cells to cytotoxic and targeted therapeutics. In conclusion, MCL-1 is an essential effector of FLT3-ITD-mediated drug resistance. Therapeutic targeting of MCL-1 is a promising strategy to overcome drug resistance in FLT3-ITD-positive AML.


Figures
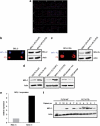
Figure 1
Figure 1
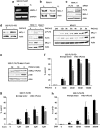
Differential expression of antiapoptotic BCL-2 family members in FLT3-ITD-positive cell lines and primary AML blasts. (a) Antibody array analyzing expression and/or phosphorylation of 615 proteins in duplicates using lysates from FL stimulated 32D FLT3-WT (100 ng/ml for 30 min) and non-stimulated 32D FLT3-ITD cells. Data obtained from the antibody array was filtered as described. (b–d) FLT3-ITD-expressing cells show upregulation of BCL-XL and MCL-1, but not BCL-2, as compared with FLT3-WT-expressing cells or cells without FLT3 receptor expression. Whole-cell lysates from non-stimulated FLT3-ITD harboring MV4;11 and 32D cells, from FL stimulated (100 ng/ml for 30 min) FLT3-WT-harboring RS4;11 and 32D cells and IL3 stimulated parental 32D cells were analyzed by immunoblotting using specific antibodies for BCL-2 (b), BCL-XL (c) and MCL-1 (d). To control equal loading, the blots were reprobed with an antibody recognizing Actin. (e) MCL-1 RNA is upregulated in FLT3-ITD-positive cells. qRT-PCR analysis of FLT3-ITD-positive MV4;11 cells and FLT3-WT RS4;11 cells using specific primers for MCL-1. Expression levels of MCL-1 were normalized to the housekeeping gene Beta-Actin and related to the basal transcription level in MV4;11 cells. (f) MCL-1 is upregulated in primary FLT3-ITD-positive AML blasts. Mononuclear cells from 12 AML patients were separated by Ficoll-Hypaque density-gradient centrifugation at the time of diagnosis or relapse. Whole-cell lysates were analyzed by immunoblotting using specific antibodies for MCL-1. To control equal loading, the blot was reprobed with an antibody recognizing Actin. Note that MCL-1 protein level was detected in all six patients harboring a FLT3-ITD mutation, whereas MCL-1 was only detected in two out of six patients harboring FLT3-WT.
Figure 2
Figure 2
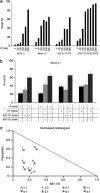
MCL-1 upregulation is dependent on FLT3 receptor signaling. (a) MCL-1 RNA is upregulated in FLT3-WT cells following stimulation with FL. Semiquantitative RT-PCR analysis of FL (100 ng/ml for 5 h)-stimulated FLT3-WT expressing 32D cells using specific primers for murine Mcl-1. Expression was normalized to the housekeeping gene GAPDH. (b) MCL-1 is upregulated upon FL stimulation of FLT3-WT cells. Whole-cell lysates from FLT3-WT RS4;11 cells were analyzed by immunoblotting using a specific antibody for MCL-1 after stimulation with FL (100 ng/ml for 5 h). Reprobing with anti-Actin served as loading control. (c, d) Knockdown of the FLT3-ITD receptor by siRNA (c) or receptor tyrosine kinase inhibition by PKC412 (d) led to time dependent downregulation of MCL-1. FLT3 and MCL-1 expression was assessed in MV4;11 cells by immunoblotting 24 h after siRNA-mediated knockdown of FLT3 (c). 32D FLT3-ITD cells and MV4;11 cells were incubated with the FLT3-TKI PKC412 at a concentration of 100 n for the indicated time periods. Whole-cell lysates were analyzed by immunoblotting using primary antibodies against phospho-FLT3, FLT3, phospho-S6 and MCL-1 (d). Blots were reprobed for Actin expression to ensure equal protein loading. (e) Stable expression of a FLAG-tagged murine Mcl-1 cDNA (FLAG-MCL-1) led to sustained transgene expression in the presence of PKC412. Whole-cell lysates were obtained from FLAG-MCL-1-32D FLT3-ITD cells following incubation with PKC412 at different concentrations for 7 h, and were analyzed by immunoblotting using the indicated primary antibodies. (f) Expression of FLAG-MCL-1 confers resistance to PKC412. FLAG-MCL-1 32D FLT3-ITD cells were incubated with the indicated concentrations of PKC412 for 24 h. The percentage of apoptotic cells with subgenomic DNA was flow cytometrically assessed. Asterisks denote statistically significant (P<0.05, t-test). (g, h) Expression of FLAG-MCL-1 confers resistance to cytarabine and daunorubicin. FLAG-MCL-1 32D FLT3-ITD cells were incubated for 24 h at the indicated drug concentrations. The percentage of apoptotic cells with subgenomic DNA was flow cytometrically assessed. Asterisks denote statistically significant (P<0.05, t-test).
Figure 3
Figure 3
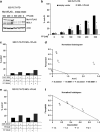
Suppression of MCL-1 by siRNA sensitizes FLT3-ITD-positive cells to cytotoxic drugs. (a) MV4,11 cells were transfected with MCL-1-specific siRNA or scrambled control. Whole-cell lysates were analyzed for protein expression of MCL-1 and Actin (as loading control). (b) MV4,11 cells treated as in (a) were incubated with or without cytarabine (5 μ) for 24 h, and the fraction of apoptotic cells with subgenomic DNA was quantified by flow cytometry. Asterisks denote statistically significant (P<0.05, t-test).
Figure 4
Figure 4
Flavopiridol suppresses MCL-1 in FLT3-ITD-positive cells. (a) Flavopiridol suppresses MCL-1 RNA expression in FLT3-ITD-positive cells. MV4;11 and Molm13 cells were incubated for 5 h with flavopiridol at several concentrations, followed by RNA extraction and reverse transcription. Expression of MCL-1 and Beta-Actin was measured by qRT-PCR; MCL-1 levels were normalized to Beta-Actin. Values were related to the untreated medium control. (b) Dose-dependent suppression of MCL-1 protein expression in FLT3-ITD-positive cells by flavopiridol. MV4;11 cells were incubated for 5 h with flavopiridol at incremental concentrations. Whole-cell lysates were analyzed for MCL-1 and Actin expression (as loading control) by immunoblotting. (c) Flavopiridol suppresses MCL-1 but not BCL-2 in FLT3-ITD-positive cells. MV4;11 and Molm-13 cells were incubated for 5 h with flavopiridol at incremental concentrations as indicated. Whole-cell lysates were analyzed for expression of MCL-1, BCL-2 and Actin (as loading control) by immunoblotting. Flavopiridol used at MCL-1-suppressing concentrations does not act on MAPK activation (d) or FLT3 autophosphorylation (e). MV4;11 and RS4;11 cells were incubated for 5 h with flavopiridol at incremental concentrations or PKC412 100 n, respectively. Whole-cell lysates were analyzed by immunoblotting for expression of p-ERK, ERK and Actin (d) or p-FLT3, FLT3, MCL-1 and Actin (e).
Figure 5
Figure 5
Activity of flavopiridol monotherapy and in combination with anticancer agents in FLT3-ITD-positive cells. (a) MV4;11, Molm-13, 32D FLT3-ITD and 32D FLT3-ITD_627E cells were incubated with flavopiridol at the indicated concentrations for 24 h (MV4;11 and 32D) or 48 h (Molm-13). The percentage of apoptotic cells with subgenomic DNA was assessed by flow cytometry. (b) MV4;11 cells were incubated for 48 h with flavopiridol (FP), ABT-737 or combinations thereof, and the percentage of apoptotic cells with subgenomic DNA was assessed by flow cytometry. (c) MV4;11 cells were incubated for 48 h with flavopiridol (25, 50, 100, 200 and 500 n) or ABT-737 (10, 25, 50, 100, 200 and 500 n). In addition, cells were incubated with flavopiridol (25, 50, 100 and 200 n) in combination with ABT-737 (25 or 50 n). Percentage of apoptotic cells with subgenomic DNA (fractional effect) was assessed by flow cytometry. Combination indices were calculated using the CalcuSyn software; normalized isobolograms are represented. The actual combination indices for all treatments are listed in Table 1a. Combination indices ranging from 0.1 to 0.85 indicate strong to moderate synergism, indices from 0.85 to 0.9 slight synergism, indices from 0.9 to 1.1 nearly additive interaction and indices from 1.1 to 10 slight to strong antagonism, respectively.
Figure 6
Figure 6
Activity of flavopiridol in combination with cytotoxic drugs in FLT3-ITD-positive cells. 32D FLT3-ITD-positive cells were incubated for 24 h with flavopiridol (FP), cytarabine (Ara-C) (a), daunorubicin (DNR) (c) or combinations thereof. The percentage of apoptotic cells with subgenomic DNA was assessed by flow cytometry. (b, d) 32D FLT3-ITD cells were incubated for 24 h with flavopiridol (25, 50, 100, 200 and 500 n), cytarabine (1, 2, 3, 5, 10 and 20 μ) or daunorubicin (25, 50, 100, 150, 200 and 500 n). In addition, cells were incubated with flavopiridol (25, 50, 100 and 200 n) in combination with cytarabine (3 μ) (b) or daunorubicin (100 n) (d). Percentage of apoptotic cells with subgenomic DNA (fractional effect) was assessed by flow cytometry. Combination indices were calculated using the CalcuSyn software; normalized isobolograms are represented. The actual combination indices for all treatments are listed in Table 1b. Combination indices ranging from 0.1 to 0.85 indicate strong to moderate synergism, indices from 0.85 to 0.9 slight synergism, indices from 0.9 to 1.1 nearly additive interaction and indices from 1.1 to 10 slight to strong antagonism, respectively.
Figure 7
Figure 7
MCL-1 protects FLT3-ITD-positive cells against the proapoptotic activity of flavopiridol. (a) 32D FLT3-ITD cells were transfected to stably express a FLAG-MCL-1 construct or control vector. Expression of endogenous MCL-1 and transgenic FLAG-MCL-1 in relation to flavopiridol (FP, 5 h) treatment was assessed by immunoblotting. Actin was probed as loading control. (b) Expression of FLAG-MCL-1 rescues FLT3-ITD-positive cells from flavopiridol-induced apoptosis. 32D FLT3-ITD cells transfected with FLAG-MCL-1 or control vectors were incubated for 24 h with flavopiridol (FP) at incremental concentrations. The percentage of apoptotic cells with subgenomic DNA was quantified by flow cytometry. Asterisks denote statistically significant (P<0.05, t-test). (c, e) Expression of FLAG-MCL-1 protects FLT3-ITD-positive cells against apoptosis induced by cytarabine (Ara-C) (c), daunorubicin (DNR) (e) alone and in combination with flavopiridol (FP). 32D FLT3-ITD cells transfected with FLAG-MCL-1 or control vectors were incubated for 24 h with flavopiridol (FP), cytarabine (Ara-C), daunorubicin (DNR) or combinations thereof. The percentage of apoptotic cells with subgenomic DNA was quantified by flow cytometry. (d, f) 32D FLT3-ITD cells transfected with FLAG-MCL-1 were incubated for 24 h with flavopiridol (25, 50, 100, 200 and 500 n), cytarabine (1, 2, 3, 5, 10 and 20 μ) or daunorubicin (25, 50, 100, 150, 200 and 500 n). In addition, cells were incubated with flavopiridol (25, 50, 100 and 200 n) in combination with cytarabine (3 μ) (d) or daunorubicin (100 n) (f). Percentage of apoptotic cells with subgenomic DNA (fractional effect) was assessed by flow cytometry. Combination indices were calculated using the CalcuSyn software; normalized isobolograms are represented. The actual combination indices for all treatments are listed in Table 1b. Combination indices ranging from 0.1 to 0.85 indicate strong to moderate synergism, indices from 0.85 to 0.9 slight synergism, indices from 0.9 to 1.1 nearly additive interaction and indices from 1.1 to 10 slight to strong antagonism, respectively.

Similar articles

Cited by

References

    1. Nakao M, Yokota S, Iwai T, Kaneko H, Horiike S, Kashima K, et al. Internal tandem duplication of the flt3 gene found in acute myeloid leukemia. Leukemia. 1996;10:1911–1918. - PubMed
    1. Stirewalt DL, Radich JP. The role of FLT3 in haematopoietic malignancies. Nat Rev Cancer. 2003;3:650–665. - PubMed
    1. Yamamoto Y, Kiyoi H, Nakano Y, Suzuki R, Kodera Y, Miyawaki S, et al. Activating mutation of D835 within the activation loop of FLT3 in human hematologic malignancies. Blood. 2001;97:2434–2439. - PubMed
    1. Schnittger S, Schoch C, Dugas M, Kern W, Staib P, Wuchter C, et al. Analysis of FLT3 length mutations in 1003 patients with acute myeloid leukemia: correlation to cytogenetics, FAB subtype, and prognosis in the AMLCG study and usefulness as a marker for the detection of minimal residual disease. Blood. 2002;100:59–66. - PubMed
    1. Kindler T, Breitenbuecher F, Kasper S, Estey E, Giles F, Feldman E, et al. Identification of a novel activating mutation (Y842C) within the activation loop of FLT3 in patients with acute myeloid leukemia (AML) Blood. 2005;105:335–340. - PubMed