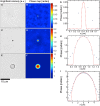
Optical quantification of cellular mass, volume, and density of circulating tumor cells identified in an ovarian cancer patient
- PMID: 22826822
- PMCID: PMC3399133
- DOI: 10.3389/fonc.2012.00072
Optical quantification of cellular mass, volume, and density of circulating tumor cells identified in an ovarian cancer patient
Abstract
Clinical studies have demonstrated that circulating tumor cells (CTCs) are present in the blood of cancer patients with known metastatic disease across the major types of epithelial malignancies. Recent studies have shown that the concentration of CTCs in the blood is prognostic of overall survival in breast, prostate, colorectal, and non-small cell lung cancer. This study characterizes CTCs identified using the high-definition (HD)-CTC assay in an ovarian cancer patient with stage IIIC disease. We characterized the physical properties of 31 HD-CTCs and 50 normal leukocytes from a single blood draw taken just prior to the initial debulking surgery. We utilized a non-interferometric quantitative phase microscopy technique using brightfield imagery to measure cellular dry mass. Next we used a quantitative differential interference contrast microscopy technique to measure cellular volume. These techniques were combined to determine cellular dry mass density. We found that HD-CTCs were more massive than leukocytes: 33.6 ± 3.2 pg (HD-CTC) compared to 18.7 ± 0.6 pg (leukocytes), p < 0.001; had greater volumes: 518.3 ± 24.5 fL (HD-CTC) compared to 230.9 ± 78.5 fL (leukocyte), p < 0.001; and possessed a decreased dry mass density with respect to leukocytes: 0.065 ± 0.006 pg/fL (HD-CTC) compared to 0.085 ± 0.004 pg/fL (leukocyte), p < 0.006. Quantification of HD-CTC dry mass content and volume provide key insights into the fluid dynamics of cancer, and may provide the rationale for strategies to isolate, monitor or target CTCs based on their physical properties. The parameters reported here can also be incorporated into blood cell flow models to better understand metastasis.
Keywords: cellular density; cellular mass; cellular volume; circulating tumor cell; differential interference contrast; ovarian cancer; quantitative phase microscopy.
Figures


Similar articles
-
Quantification of cellular volume and sub-cellular density fluctuations: comparison of normal peripheral blood cells and circulating tumor cells identified in a breast cancer patient.Front Oncol. 2012 Aug 9;2:96. doi: 10.3389/fonc.2012.00096. eCollection 2012. Front Oncol. 2012. PMID: 22934287 Free PMC article.
-
mRNA expression profiles in circulating tumor cells of metastatic colorectal cancer patients.Mol Oncol. 2015 Apr;9(4):920-32. doi: 10.1016/j.molonc.2015.01.001. Epub 2015 Jan 21. Mol Oncol. 2015. PMID: 25655581 Free PMC article.
-
Prognostic impact of circulating tumor cell apoptosis and clusters in serial blood samples from patients with metastatic breast cancer in a prospective observational cohort.BMC Cancer. 2016 Jul 8;16:433. doi: 10.1186/s12885-016-2406-y. BMC Cancer. 2016. PMID: 27390845 Free PMC article.
-
Current and future role of circulating tumor cells in patients with epithelial ovarian cancer.Eur J Surg Oncol. 2016 Dec;42(12):1772-1779. doi: 10.1016/j.ejso.2016.05.010. Epub 2016 May 25. Eur J Surg Oncol. 2016. PMID: 27265041 Review.
-
Circulating tumor cells as promising novel biomarkers in solid cancers.Crit Rev Clin Lab Sci. 2014 Jun;51(3):160-71. doi: 10.3109/10408363.2014.896316. Epub 2014 Mar 19. Crit Rev Clin Lab Sci. 2014. PMID: 24641350 Review.
Cited by
-
May CTC technologies promote better cancer management?EPMA J. 2015 Jan 22;6(1):1. doi: 10.1186/s13167-014-0023-x. eCollection 2015. EPMA J. 2015. PMID: 25628770 Free PMC article.
-
Response to Comment on "Is the nuclear refractive index lower than cytoplasm? Validation of phase measurements and implications for light scattering technologies": A Comment on "How a phase image of a cell with nucleus refractive index smaller than that of the cytoplasm should look like?", e201800033.J Biophotonics. 2018 Jun;11(6):e201800091. doi: 10.1002/jbio.201800091. Epub 2018 May 2. J Biophotonics. 2018. PMID: 29722169 Free PMC article.
-
Live-cell mass profiling: an emerging approach in quantitative biophysics.Nat Methods. 2014 Dec;11(12):1221-8. doi: 10.1038/nmeth.3175. Nat Methods. 2014. PMID: 25423019 Free PMC article.
-
Do circulating tumor cells play a role in coagulation and thrombosis?Front Oncol. 2012 Sep 10;2:115. doi: 10.3389/fonc.2012.00115. eCollection 2012. Front Oncol. 2012. PMID: 22973557 Free PMC article.
-
miR-200c Regulation of Metastases in Ovarian Cancer: Potential Role in Epithelial and Mesenchymal Transition.Front Pharmacol. 2016 Aug 23;7:271. doi: 10.3389/fphar.2016.00271. eCollection 2016. Front Pharmacol. 2016. PMID: 27601996 Free PMC article. Review.
References
-
- Allard W. J., Mater J., Miller M. C., Repollet M., Connelly M. C., Rao C., Tibbe A. G. J., Uhr J. W., Terstappen L. W. M. M. (2004). Tumor cells circulate in the peripheral blood of all major carcinomas but not in healthy subjects of patients with nonmalignant disease. Clin. Cancer Res. 10, 6897–690410.1158/1078-0432.CCR-04-0378 - DOI - PubMed
-
- Anderson G. L., McIntosh M., Wu L., Thorpe J. D., Bergan L., Thornquist M. D., Scholler N., Kim N., O’Briant K., Drescher C., Urban N. (2010). Assessing lead time of selected ovarian cancer biomarkers: a nested case-control study. J. Natl. Cancer Inst. 102, 26–3810.1093/jnci/djp438 - DOI - PMC - PubMed
Grants and funding
LinkOut - more resources
Full Text Sources
Other Literature Sources

