. 2012 Jul 30;209(8):1445-56.
doi: 10.1084/jem.20120504. Epub 2012 Jul 23.

Familial transmission rather than defective innate immunity shapes the distinct intestinal microbiota of TLR-deficient mice

Affiliations

Familial transmission rather than defective innate immunity shapes the distinct intestinal microbiota of TLR-deficient mice

Carles Ubeda et al. J Exp Med. .

Abstract

The intestinal microbiota contributes to the development of the immune system, and conversely, the immune system influences the composition of the microbiota. Toll-like receptors (TLRs) in the gut recognize bacterial ligands. Although TLR signaling represents a major arm of the innate immune system, the extent to which TLRs influence the composition of the intestinal microbiota remains unclear. We performed deep 16S ribosomal RNA sequencing to characterize the complex bacterial populations inhabiting the ileum and cecum of TLR- and MyD88-deficient mice. The microbiota of MyD88- and TLR-deficient mouse colonies differed markedly, with each colony harboring distinct and distinguishable bacterial populations in the small and large intestine. Comparison of MyD88-, TLR2-, TLR4-, TLR5-, and TLR9-deficient mice and their respective wild-type (WT) littermates demonstrated that the impact of TLR deficiency on the composition of the intestinal microbiota is minimal under homeostatic conditions and after recovery from antibiotic treatment. Thus, differences between TLR-deficient mouse colonies reflected long-term divergence of the microbiota after extended husbandry in isolation from each other. Long-term breeding of isolated mouse colonies results in changes of the intestinal microbiota that are communicated to offspring by maternal transmission, which account for marked compositional differences between WT and mutant mouse strains.


Figures

Figure 1.
Figure 1.
Impact of TLR signaling versus lineage origin on the overall microbial composition of the cecal microbiota. (A) PCoA plot of the unweighted UniFrac analysis of cecal samples of MyD88, TLR2, TLR4, TLR5, or TLR9 KO mouse colonies and their respective WT/Het littermates. Each mouse colony contains five to seven KO and five to seven WT/Het mice and is labeled with a different color, as indicated. When mouse colonies are analyzed separately, the litter origin of each mouse is indicated with a different symbol shape. (B) The mean UniFrac distances for each mouse in a colony versus (a) all other mice from the same litter with the same genotype, (b) all other mice from the same litter that had a different genotype, or (c) all other mice within that colony belonging to a different litter were calculated and plotted. A higher UniFrac distance denotes greater dissimilarity between two microbial communities. Error bars indicate ±SEM. Asterisks denote statistically significant differences in UniFrac distances between groups (Student's t test: *, P < 0.05; ***, P < 0.001).
Figure 2.
Figure 2.
Maternal effect on the microbiota composition. Cecal microbiota samples were clustered by similarity using the UPGMA clustering algorithm on the unweighted UniFrac distance matrix. Colors indicate the mouse maternal origin. Samples were named using the following four-label code: (1) mouse colony (M, MyD88; T2, TLR2; T4, TLR4; T5, TLR5; and T9, TLR9), (2) mouse family identified with a letter, with consecutive litters from the same mother differentiated with a number, (3) mouse genotype (H, heterozygous; K, KO; and W, WT), and (4) mouse ID number. Samples are clustered by maternal origin, as indicated with labels outside the circle tree. Consecutive litters from the same mother (distinguished by numbers) clustered together, indicating the major role of maternal origin on the microbiota composition from TLR-deficient colonies. Each mouse colony contains five to seven KO and five to seven WT/Het mice.
Figure 3.
Figure 3.
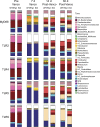
Impact of TLR signaling on the bacterial composition of the intestinal microbiota. Phylogenetic classification of 16S rDNA frequencies in the ileum or cecum samples from colonies of MyD88, TLR2, TLR4, TLR5, or TLR9 KO mice and their respective WT/Het controls. Each bar represents the mean of the microbiota composition from five to seven mice. The most predominant bacterial taxa are shown and labeled with different colors as indicated. Bacterial taxa were obtained by classification of 16s rDNA sequences to the genus level using mothur. In case a sequence could not be classified to the genus level, the closest level of classification to the genus level was given, preceded by UC (unclassified).
Figure 4.
Figure 4.
Impact of TLR signaling versus lineage origin on specific bacterial taxa of the intestinal microbiota. Heat map showing statistically significant changes (Student's t test, P < 0.05; FDR ≤ 0.1) on different intestinal bacterial taxa (red) between WT/Het and KO mice (n = 5–7 mice/genotype) or between different litters within a mouse colony (n = 4–8 mice/litter). Bacterial taxa were obtained by classification of 16s rDNA sequences to the genus level using mothur. In case a sequence could not be classified to the genus level, the closest level of classification to the genus level was given, preceded by UC (unclassified). Only those taxa that were found to be statistically significant at least once are shown. Ce, cecal contents; IC, ileum contents; IW, ileum wall.
Figure 5.
Figure 5.
Impact of TLR signaling on the fecal microbiota composition after antibiotic treatment. MyD88, TLR2, TLR4, TLR5, or TLR9 KO mice and WT/Het littermate controls were treated with vancomycin (Vanco) for 7 d on their drinking water. Fecal samples were obtained before treatment, 1 wk after vancomycin treatment, and 2 and 4 wk after antibiotic withdrawal. Phylogenetic classification of 16S rDNA frequencies in fecal samples was obtained by high-throughput sequencing and mothur sequencing analysis. Each bar represents the mean of the microbiota composition from four to seven mice. The most predominant bacterial taxa are shown and labeled with different colors as indicated.
Figure 6.
Figure 6.
Impact of TLR signaling on the diversity and richness of the intestinal microbiota after antibiotic treatment. (A and B) Myd88, TLR2, TLR4, TLR5, or TLR9 KO mice and WT/Het littermate controls were treated with vancomycin (vanco) for 7 d on their drinking water. Fecal samples were obtained before treatment, 1 wk after vancomycin treatment, and 2 and 4 wk after antibiotic withdrawal. The Shannon diversity index and Chao richness index were obtained by 16s rDNA high-throughput sequencing and mothur analysis. Student's t test was performed between groups of KO mice and their respective WT/Het controls to analyze the impact of TLR signaling on the overall microbial diversity and richness (n = 4–7 mice/genotype). Horizontal bars indicate the mean. The asterisk denotes significance (*, P < 0.05).
Figure 7.
Figure 7.
Impact of TLR signaling versus lineage origin on the overall microbial composition of the fecal microbiota after antibiotic treatment. PCoA plot from the unweighted UniFrac analysis of fecal samples from colonies of MyD88, TLR2, TLR4, TLR5, or TLR9 KO mice and their respective WT/Het littermates. Mice were treated with vancomycin (vanco), and fecal samples were obtained before treatment, 1 wk after vancomycin treatment, or 2 and 4 wk after antibiotic withdrawal. Symbol shapes denote the different litters of mice within a colony. Each mouse colony contains four to seven KO mice and four to seven WT/Het mice.
Figure 8.
Figure 8.
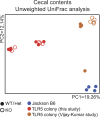
Husbandry impact on the effect of TLR5 signaling on the microbiota composition. PCoA plot from the unweighted UniFrac analysis of cecal samples from WT B6 mice from the Jackson Laboratory maintained for 2 wk in our animal facility (n = 4), TLR5-deficient mice raised in our animal facility (n = 6) and their respective WT littermate controls (n = 6), and TLR5-deficient mice from Vijay-Kumar et al. (2010; n = 5) and their respective WT littermate controls (n = 4).

Similar articles

Cited by

References

    1. Anders S., Huber W. 2010. Differential expression analysis for sequence count data. Genome Biol. 11:R106 10.1186/gb-2010-11-10-r106 - DOI - PMC - PubMed
    1. Antonopoulos D.A., Huse S.M., Morrison H.G., Schmidt T.M., Sogin M.L., Young V.B. 2009. Reproducible community dynamics of the gastrointestinal microbiota following antibiotic perturbation. Infect. Immun. 77:2367–2375 10.1128/IAI.01520-08 - DOI - PMC - PubMed
    1. Benjamini Y., Hochberg Y. 1995. Controlling the false discovery rate: A practical and powerful approach to multiple testing. J. R. Stat. Soc. Series B. 57:289–300
    1. Bik E.M., Eckburg P.B., Gill S.R., Nelson K.E., Purdom E.A., Francois F., Perez-Perez G., Blaser M.J., Relman D.A. 2006. Molecular analysis of the bacterial microbiota in the human stomach. Proc. Natl. Acad. Sci. USA. 103:732–737 10.1073/pnas.0506655103 - DOI - PMC - PubMed
    1. Brandl K., Plitas G., Mihu C.N., Ubeda C., Jia T., Fleisher M., Schnabl B., DeMatteo R.P., Pamer E.G. 2008. Vancomycin-resistant enterococci exploit antibiotic-induced innate immune deficits. Nature. 455:804–807 10.1038/nature07250 - DOI - PMC - PubMed

Publication types

MeSH terms