

Inhibition of EGFR/MAPK signaling reduces microglial inflammatory response and the associated secondary damage in rats after spinal cord injury
- PMID: 22824323
- PMCID: PMC3418570
- DOI: 10.1186/1742-2094-9-178
Inhibition of EGFR/MAPK signaling reduces microglial inflammatory response and the associated secondary damage in rats after spinal cord injury
Abstract
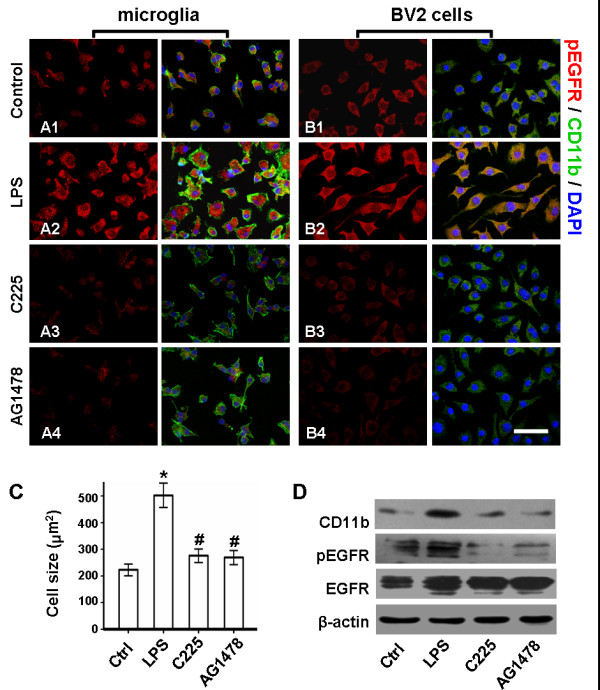
Background: Emerging evidence indicates that reactive microglia-initiated inflammatory responses are responsible for secondary damage after primary traumatic spinal cord injury (SCI); epidermal growth factor receptor (EGFR) signaling may be involved in cell activation. In this report, we investigate the influence of EGFR signaling inhibition on microglia activation, proinflammatory cytokine production, and the neuronal microenvironment after SCI.
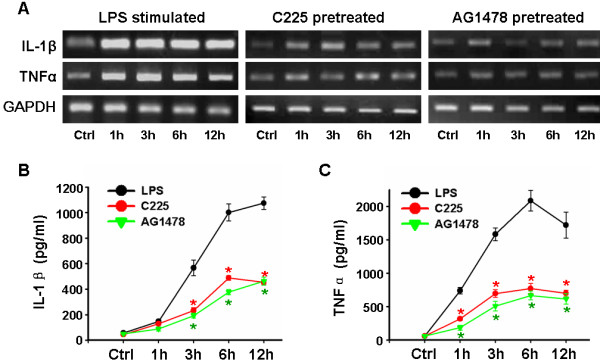
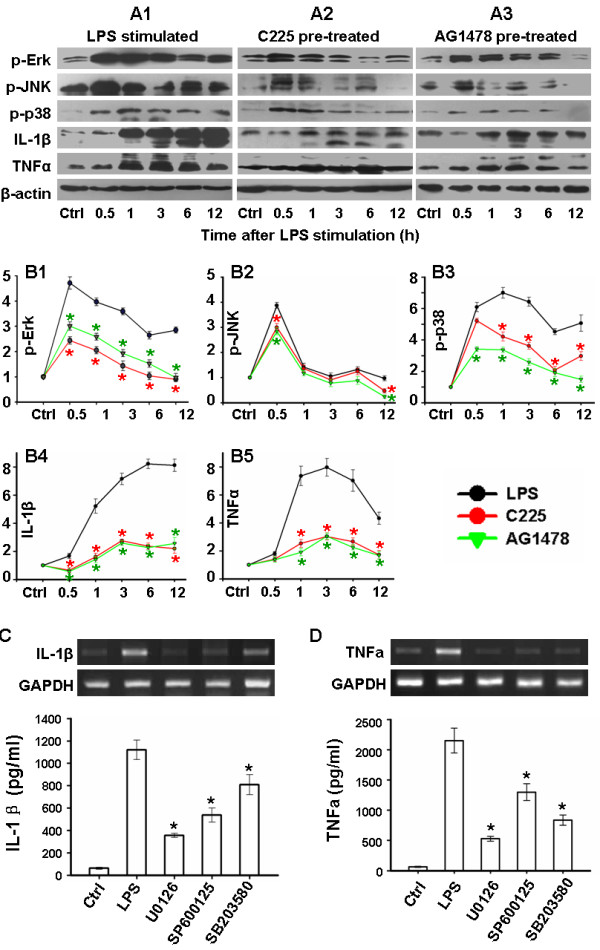
Methods: Lipopolysaccharide-treated primary microglia/BV2 line cells and SCI rats were used as model systems. Both C225 and AG1478 were used to inhibit EGFR signaling activation. Cell activation and EGFR phosphorylation were observed after fluorescent staining and western blot. Production of interleukin-1 beta (IL-1 β) and tumor necrosis factor alpha (TNF α) was tested by reverse transcription PCR and ELISA. Western blot was performed to semi-quantify the expression of EGFR/phospho-EGFR, and phosphorylation of Erk, JNK and p38 mitogen-activated protein kinases (MAPK). Wet-dry weight was compared to show tissue edema. Finally, axonal tracing and functional scoring were performed to show recovery of rats.
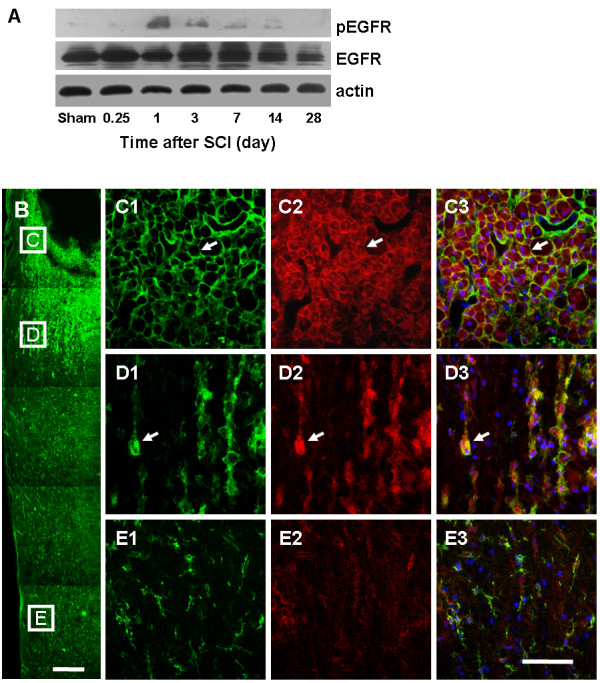
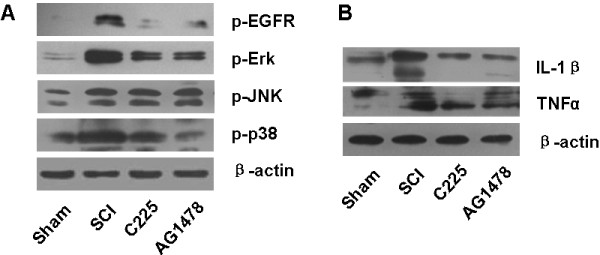
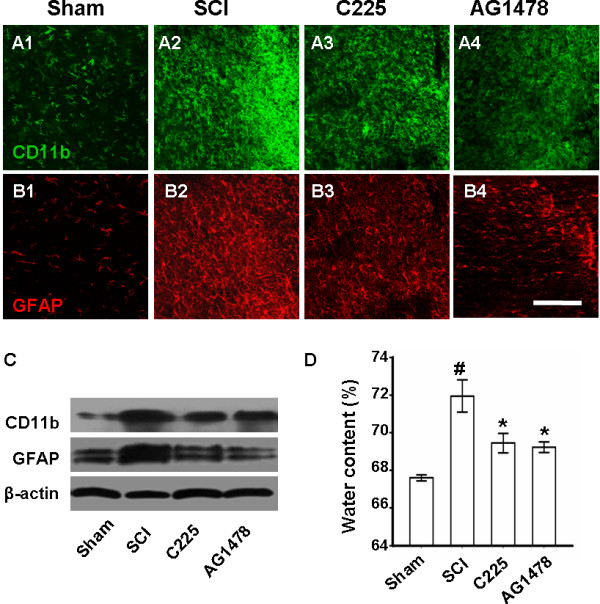
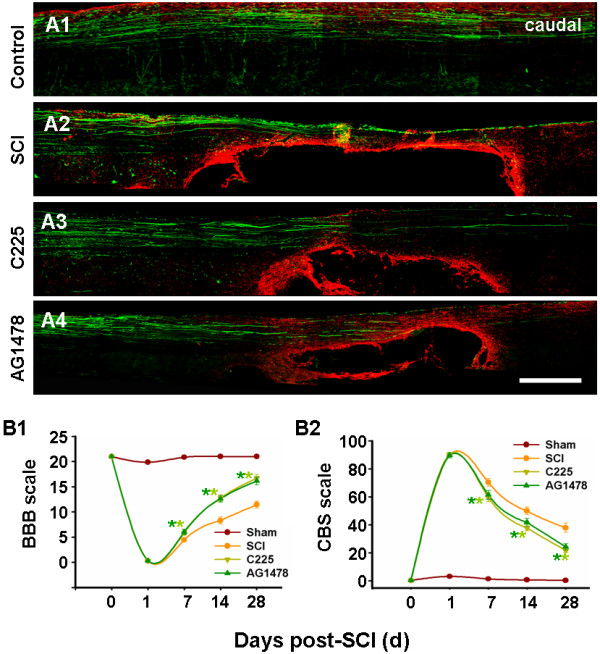
Results: EGFR phosphorylation was found to parallel microglia activation, while EGFR blockade inhibited activation-associated cell morphological changes and production of IL-1 β and TNF α. EGFR blockade significantly downregulated the elevated MAPK activation after cell activation; selective MAPK inhibitors depressed production of cytokines to a certain degree, suggesting that MAPK mediates the depression of microglia activation brought about by EGFR inhibitors. Subsequently, seven-day continual infusion of C225 or AG1478 in rats: reduced the expression of phospho-EGFR, phosphorylation of Erk and p38 MAPK, and production of IL-1 β and TNF α; lessened neuroinflammation-associated secondary damage, like microglia/astrocyte activation, tissue edema and glial scar/cavity formation; and enhanced axonal outgrowth and functional recovery.
Conclusions: These findings indicate that inhibition of EGFR/MAPK suppresses microglia activation and associated cytokine production; reduces neuroinflammation-associated secondary damage, thus provides neuroprotection to SCI rats, suggesting that EGFR may be a therapeutic target, and C225 and AG1478 have potential for use in SCI treatment.
Figures
Similar articles
-
A Causal Relationship in Spinal Cord Injury Rat Model Between Microglia Activation and EGFR/MAPK Detected by Overexpression of MicroRNA-325-3p.J Mol Neurosci. 2019 Jun;68(2):181-190. doi: 10.1007/s12031-019-01297-w. Epub 2019 Mar 25. J Mol Neurosci. 2019. PMID: 30911940
-
Epidermal growth factor receptor inhibitor ameliorates excessive astrogliosis and improves the regeneration microenvironment and functional recovery in adult rats following spinal cord injury.J Neuroinflammation. 2014 Apr 5;11:71. doi: 10.1186/1742-2094-11-71. J Neuroinflammation. 2014. PMID: 24708754 Free PMC article.
-
Advanced oxidation protein products induce microglia-mediated neuroinflammation via MAPKs-NF-κB signaling pathway and pyroptosis after secondary spinal cord injury.J Neuroinflammation. 2020 Mar 20;17(1):90. doi: 10.1186/s12974-020-01751-2. J Neuroinflammation. 2020. PMID: 32192500 Free PMC article.
-
Inflammation after spinal cord injury: a review of the critical timeline of signaling cues and cellular infiltration.J Neuroinflammation. 2021 Dec 7;18(1):284. doi: 10.1186/s12974-021-02337-2. J Neuroinflammation. 2021. PMID: 34876174 Free PMC article. Review.
-
Glial-Neuronal Interactions in Pathogenesis and Treatment of Spinal Cord Injury.Int J Mol Sci. 2021 Dec 17;22(24):13577. doi: 10.3390/ijms222413577. Int J Mol Sci. 2021. PMID: 34948371 Free PMC article. Review.
Cited by
-
Na/K-ATPase as a target for anticancer drugs: studies with perillyl alcohol.Mol Cancer. 2015 May 15;14:105. doi: 10.1186/s12943-015-0374-5. Mol Cancer. 2015. PMID: 25976744 Free PMC article.
-
Roles of Non-coding RNAs and Angiogenesis in Glioblastoma.Front Cell Dev Biol. 2021 Sep 27;9:716462. doi: 10.3389/fcell.2021.716462. eCollection 2021. Front Cell Dev Biol. 2021. PMID: 34646821 Free PMC article. Review.
-
A Causal Relationship in Spinal Cord Injury Rat Model Between Microglia Activation and EGFR/MAPK Detected by Overexpression of MicroRNA-325-3p.J Mol Neurosci. 2019 Jun;68(2):181-190. doi: 10.1007/s12031-019-01297-w. Epub 2019 Mar 25. J Mol Neurosci. 2019. PMID: 30911940
-
Nerve growth factor pretreatment inhibits lidocaine‑induced myelin damage via increasing BDNF expression and inhibiting p38 mitogen activation in the rat spinal cord.Mol Med Rep. 2017 Oct;16(4):4678-4684. doi: 10.3892/mmr.2017.7197. Epub 2017 Aug 9. Mol Med Rep. 2017. PMID: 28849178 Free PMC article.
-
Warm acupuncture therapy alleviates neuronal apoptosis after spinal cord injury via inhibition of the ERK signaling pathway.J Spinal Cord Med. 2023 Sep;46(5):798-806. doi: 10.1080/10790268.2022.2088498. Epub 2022 Jul 6. J Spinal Cord Med. 2023. PMID: 35792817 Free PMC article.
References
-
- Ambrozaitis KV, Kontautas E, Spakauskas B, Vaitkaitis D. Pathophysiology of acute spinal cord injury. Medicina (Kaunas) 2006;42:255–261. - PubMed
-
- Beck KD, Nguyen HX, Galvan MD, Salazar DL, Woodruff TM, Anderson AJ. Quantitative analysis of cellular inflammation after traumatic spinal cord injury: evidence for a multiphasic inflammatory response in the acute to chronic environment. Brain. 2010;133:433–447. doi: 10.1093/brain/awp322. - DOI - PMC - PubMed
Publication types
MeSH terms
Substances
LinkOut - more resources
Full Text Sources
Other Literature Sources
Medical
Molecular Biology Databases
Research Materials
Miscellaneous
