. 2012 Aug 14;23(2):384-96.
doi: 10.1016/j.devcel.2012.05.025. Epub 2012 Jul 19.

A Rho GTPase signal treadmill backs a contractile array

Affiliations

A Rho GTPase signal treadmill backs a contractile array

Brian M Burkel et al. Dev Cell. .

Abstract

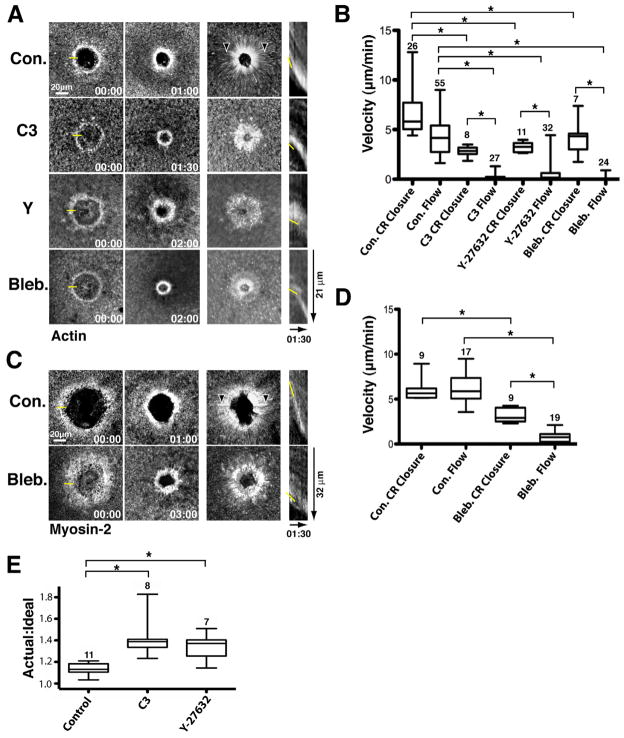
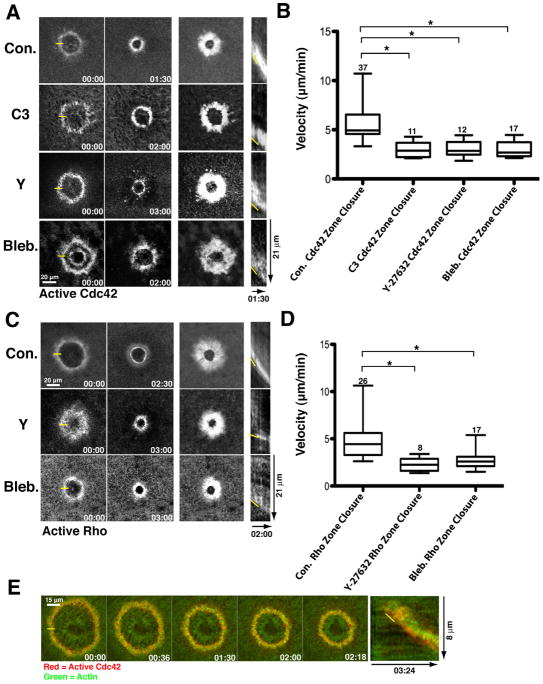
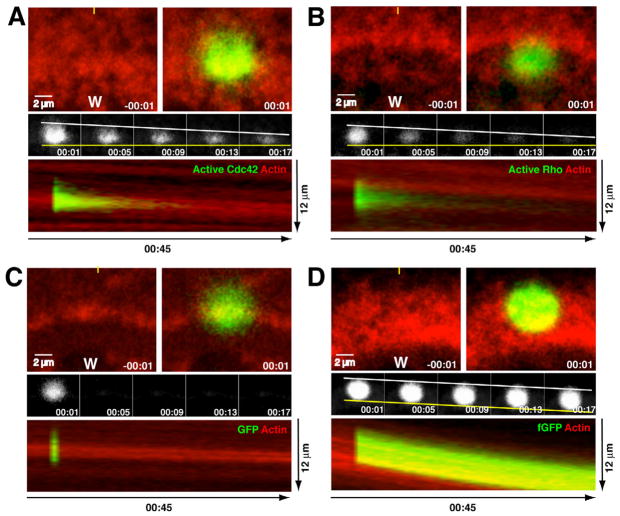
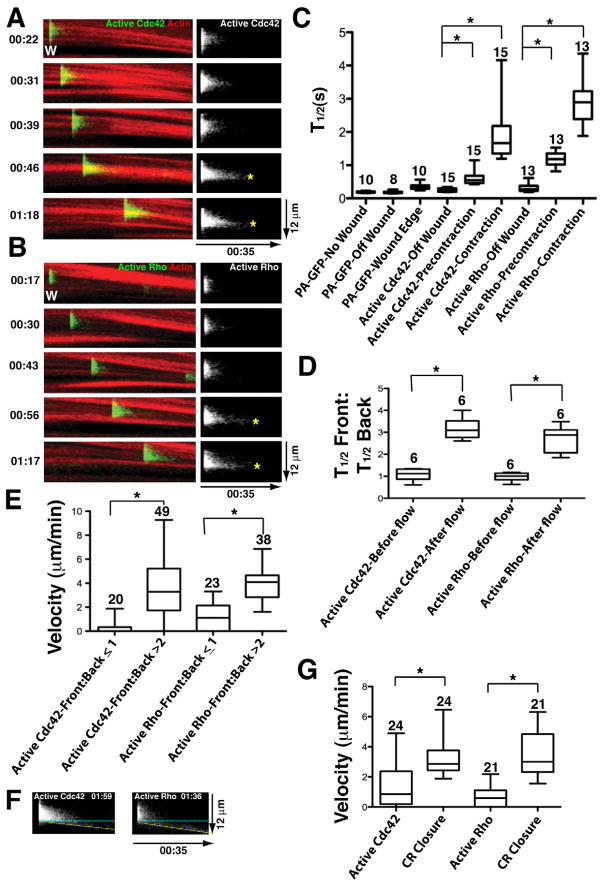
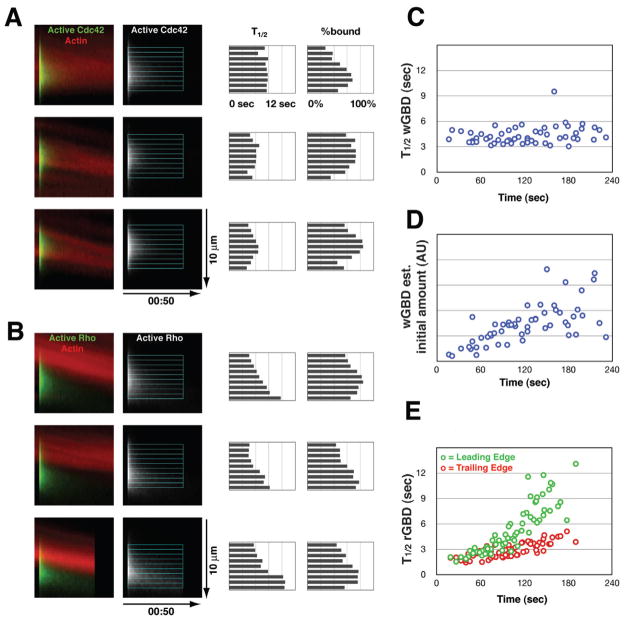
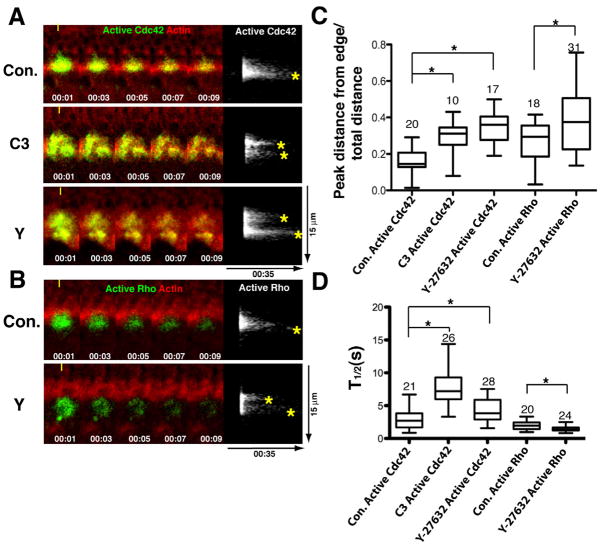
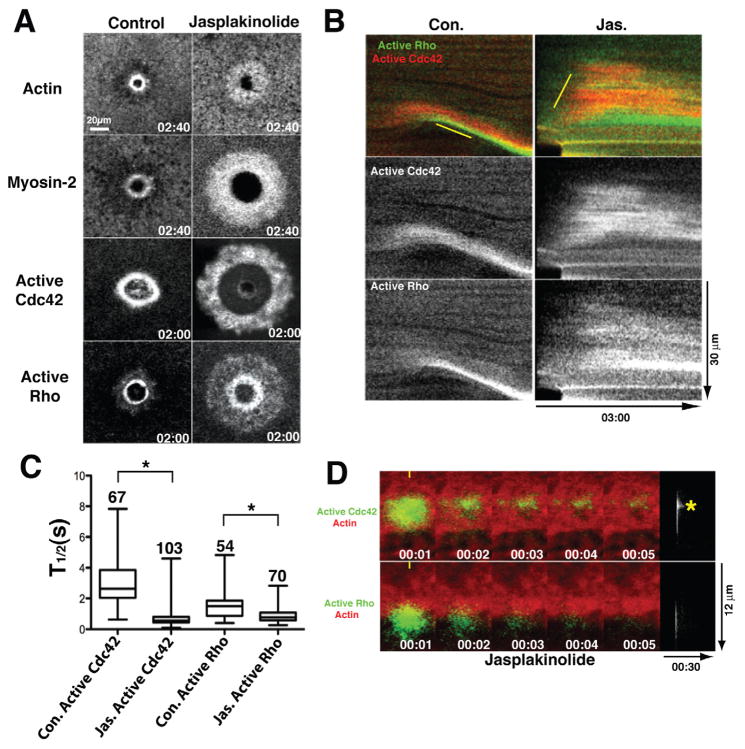
Contractile arrays of actin filaments (F-actin) and myosin-2 power diverse biological processes. Contractile array formation is stimulated by the Rho GTPases Rho and Cdc42; after assembly, array movement is thought to result from contraction itself. Contractile array movement and GTPase activity were analyzed during cellular wound repair, in which arrays close in association with zones of Rho and Cdc42 activity. Remarkably, contraction suppression prevents translocation of F-actin and myosin-2 without preventing array or zone closure. Closure is driven by an underlying "signal treadmill" in which the GTPases are preferentially activated at the leading edges and preferentially lost from the trailing edges of their zones. Treadmill organization requires myosin-2-powered contraction and F-actin turnover. Thus, directional gradients in Rho GTPase turnover impart directional information to contractile arrays, and proper functioning of these gradients is dependent on both contraction and F-actin turnover.


Figures

Figure 1
Figure 1
Contractile ring closure without contraction. A. Actin cortical flow and ring closure. Left: Time points; middle: brightest point projections and; right: Kymographs (from 1 pixel-wide lines) of fluorescent actin following wounding of control (Con.) cells or cells microinjected with C3 exotransferase (C3), Y-27632 (Y) or blebbistatin (Bleb.) to suppress contraction. Yellow line in 00:00 time point indicates where line for kymograph was positioned. Arrowheads in control brightest point projection labels streaks of flowing actin. Yellow line in kymograph identifies position of leading edge. Time is in min:sec. B. Quantification (using fluorescent actin as a marker) of contractile ring (CR) closure and cortical flow (Flow) in controls (Con.) and cells microinjected with C3 exotransferase (C3), Y-27632 or blebbistatin (Bleb.) to suppress contraction. * indicates p < 0.05. Numbers indicate N. Bars indicate S.D. C. Myosin cortical flow and ring closure. Layout and labeling as in 1A but fluorescent myosin-2 used instead of fluorescent actin. D. Quantification of myosin flow and ring closure. Layout and labeling as in 1B, but fluorescent myosin-2 used instead of fluorescent actin. E. Comparison of the actual to the ideal circumference of contractile rings in control cells and cells microinjected with C3 exotransferase (C3) or Y-27632 (Y) to suppress contraction. See also Figure S1.
Figure 2
Figure 2
Rho GTPase zones closure without contraction. A. Closure of the Cdc42 zone in controls and contraction-suppressed samples. Layout and labels as in 1A but fluorescent wGBD used to detect active Cdc42. B. Quantification of Cdc42 zone closure. Layout and labels as in 1B but fluorescent wGBD used as a marker. C. Closure of the Rho zone in controls and contraction suppressed samples. Layout and labels as in 1A but fluorescent rGBD used to detect active Rho. D. Quantification of Rho zone closure. Layout and labels as in 1B but fluorescent rGBD used to detect active Rho. E. Time course (left) and kymograph (right) showing fluorescent actin (green) and active Cdc42 (red) in C3-injected cell. Yellow line in 00:00 indicates where kymograph line was positioned. Yellow line in kymograph indicates leading edge. See also Fig. S2.
Figure 3
Figure 3
Front-to-back bias in turnover of active GTPases at wound edge. A. Turnover of active Cdc42 at wound edge assessed with PA-GFP-wGBD (green) and fluorescent actin (red). Top left panel shows wound (w) edge immediately before photoactivation; top right panel shows wound edge immediately after photoactivation. Middle panels show active Cdc42 alone from same sample as top, with leading edge of photoactivated region indicated with a yellow line and the trailing edge indicated with a white line. Lowest panel shows kymograph generated from 5 pixel wide line positioned as indicated by yellow line in top left panel. The wound is at the bottom of the panel. B. Turnover of active Rho at wound edge assessed with PA-GFP-rGBD (green) and fluorescent actin (red). Layout and labels as in 3A. C. Turnover of probe for soluble proteins at wound edge assessed with PA-GFP (green) and fluorescent actin (red). Layout and labels as in 3A. D. Turnover of probe for stable PM-associated proteins at wound edge assessed with PA-fGFP (green) and fluorescent actin (red). Layout and labels as in 3A. See also Fig. S3.
Figure 4
Figure 4
Time-dependent changes in the behavior of active Rho GTPases. A. Left panels show kymographs (made as in figure 3) of turnover of active Cdc42 at wound edge assessed with PA-GFP-wGBD (green) and fluorescent actin (red) at increasing times after wounding (Time in min:sec indicated on left; each panel from same wound). Right panels show active Cdc42 alone; asterisks indicate persistence peaks. B. Turnover of active Rho at wound edge assessed with PA-GFP-rGBD (green) and fluorescent actin. Same layout and labeling as in 4A. C. Quantification of total (ie entire photoactivated regions) half life of soluble proteins (PA-GFP), active Cdc42 or active Rho. PA-GFP was assessed in unwounded cells (no wound), in wounded cells but at > 20 μm away from the wound (off wound) or at the wound edge after the onset of contraction (Wound Edge). Active Cdc42 and Rho were assessed in wounded cells at > 20 μm away from the wound (Off wound), at the wound (ie within their zones) before the onset of contraction (Precontraction) or at the wound after the onset of contraction (Contraction). Asterisks indicate P < 0.05; numbers indicate N. Bars indicate S.D. D. Comparison of the front:back total half life ratio for active Cdc42 and Rho before (Before flow) and after (After flow) the onset of contraction. E. Comparison of the contractile ring closure velocity when the front-to-back half-life ratio is less than 1 or greater than 2 for either active Cdc42 or active Rho. F. Kymographs (made as in Fig. 3) showing examples of active Cdc42 and active Rho undergoing forward translocation. Dotted yellow line shows the leading edge of the photoactivated probe; blue dotted line shows expected position of photoactivated probe if it remains stationary. G. Comparison of velocity of forward movement of forward translocating active Cdc42 and active Rho versus velocity of contractile ring closure in the same sample.
Figure 5
Figure 5
Spatial differentiation of GTPase flux. A. Three examples of a patch of photoactivated PA-GFP-wGBD, represented as kymographs of a 4-μm slab containing the center of the patch. Left panels, color overlay of PA-GFP-wGBD (green) with fluorescent actin (red); middle panel, PA-GFP-wGBD alone with overlay to show measured 0.6-μm strips; right panels, bar charts showing halflives and percentage of probe bound inferred as shown in Supplemental Figure 4. B. Same layout and labels as in A, but with PA-GFP-rGBD. C. Scatter plot of inferred half-time for slow component of wGBD (Cdc42) turnover, versus time since wounding. D. Scatter plot of inferred initial amount of wGBD probe bound (arbitrary units: bound fraction times intensity) versus time since wounding, same set of measurements as in C; 60 measurements are shown. E. Scatter plot of inferred half-time for slow component of rGBD (Rho) turnover in leading (green) versus trailing (red) portions of the Rho zone, versus time since wounding. Leading and trailing data points are paired; 64 measurements are shown. See also Fig. S4.
Figure 6
Figure 6
Contractility is required for proper signal treadmill organization. A. Left panels show kymographs (made as in figure 3) of turnover of active Cdc42 at wound edge assessed with PA-GFP-wGBD (green) and fluorescent actin (red) in controls (Con.) or cells microinjected with C3 exotransferase (C3) or Y-27632 (Y) to suppress contraction. (Time in min:sec indicated on left; each panel from same wound). Right panels show active Cdc42 alone; asterisks indicate persistence peaks. B. Turnover of active Rho at wound edge assessed with PA-GFP-rGBD (green) and fluorescent actin (red) in controls (Con.) or cells microinjected with Y-27632 (Y) to suppress contraction. Layout and labels as in 6A. C. Comparison of the position of the persistence peak relative to the front part of the photoactivated region in controls (Con.) or cells microinjected with C3 exotransferase (C3) or Y-27632 (Y) to suppress contraction for both active Cdc42 and active Rho. 0 = peak at exact front; 1 = peak at exact back. Asterisks indicate P < 0.05; numbers indicate N. D. Quantification of total (ie of entire photoactivated regions) half life of active Cdc42 or active Rho in controls (Con.) or cells microinjected with C3 exotransferase (C3) or Y-27632 (Y) to suppress contraction. Asterisks indicate P < 0.05; numbers indicate N. Bars indicate S.D.
Figure 7
Figure 7
F-actin turnover is required for proper signal treadmill organization. A. Matched time points showing distribution of actin, myosin-2, active Cdc42 or active Rho in control cells and cells treated with jasplakinolide to suppress F-actin turnover. Time in min:sec and refers to the time post wounding. B. Kymographs made using 1 pixel-wide line showing distribution of active Cdc42 and Rho in control (Con.) and jasplakinolide (Jas.) treated cells. Top panels are double label; middle panels show active Cdc42 alone; bottom panels show active Rho alone. C. Quantification of total (ie of entire photoactivated regions) half life of active Cdc42 or active Rho in controls (Con.) or cells treated with jasplakinolide (Jas.) to suppress F-actin turnover. Asterisks indicate P < 0.05; numbers indicate N; bars indicate S.D. D. Top left panels show time points of active Cdc42 at wound edge assessed with PA-GFP-wGBD (green) and fluorescent actin (red) in presence of jasplakinolide; Top right panel shows active Cdc42 alone as kymograph (prepared as in fig. 3) from same sample as on left. Asterisk indicates persistence peak. Bottom left panels show time points of active Rho at wound edge assessed with PA-GFP-rGBD (green) and fluorescent actin (red) in presence of jasplakinolide; Bottom right panel shows active Rho alone as kymograph (prepared as in fig. 3) from same sample as on left. See also Fig. S5.

Comment in

Similar articles

Cited by

References

    1. Abreu-Blanco MT, Verboon JM, Parkhurst SM. Cell wound repair in Drosophila occurs through three distinct phases of membrane and cytoskeletal remodeling. J Cell Biol. 2011;193(3):455–64. - PMC - PubMed
    1. Bement WM, Miller AL, von Dassow G. Rho GTPase activity zones and transient contractile arrays. Bioessays. 2006;28(10):983–93. - PMC - PubMed
    1. Bement WM, Yu HY, Burkel BM, Vaughan EM, Clark AG. Rehabilitation and the single cell. Curr Opin Cell Biol. 2007;19(1):95–100. - PMC - PubMed
    1. Benink HA, Bement WM. Concentric zones of active RhoA and Cdc42 around single cell wounds. J Cell Biol. 2005;168(3):429–39. - PMC - PubMed
    1. Burkel BM, von Dassow G, Bement WM. Versatile fluorescent probes for actin filaments based on the actin-binding domain of utrophin. Cell Motil Cytoskeleton. 2007;64(11):822–32. - PMC - PubMed

Publication types

LinkOut - more resources